EPI’s top charts of 2012 are drawn from our flagship publication, The State of Working America; regularly updated Economic Indicators; weekly Economic Snapshots; and posts on Working Economics, the EPI blog. Taken together, they illustrate that in 2013, policymakers must do more to ensure the U.S. economy works for all Americans.
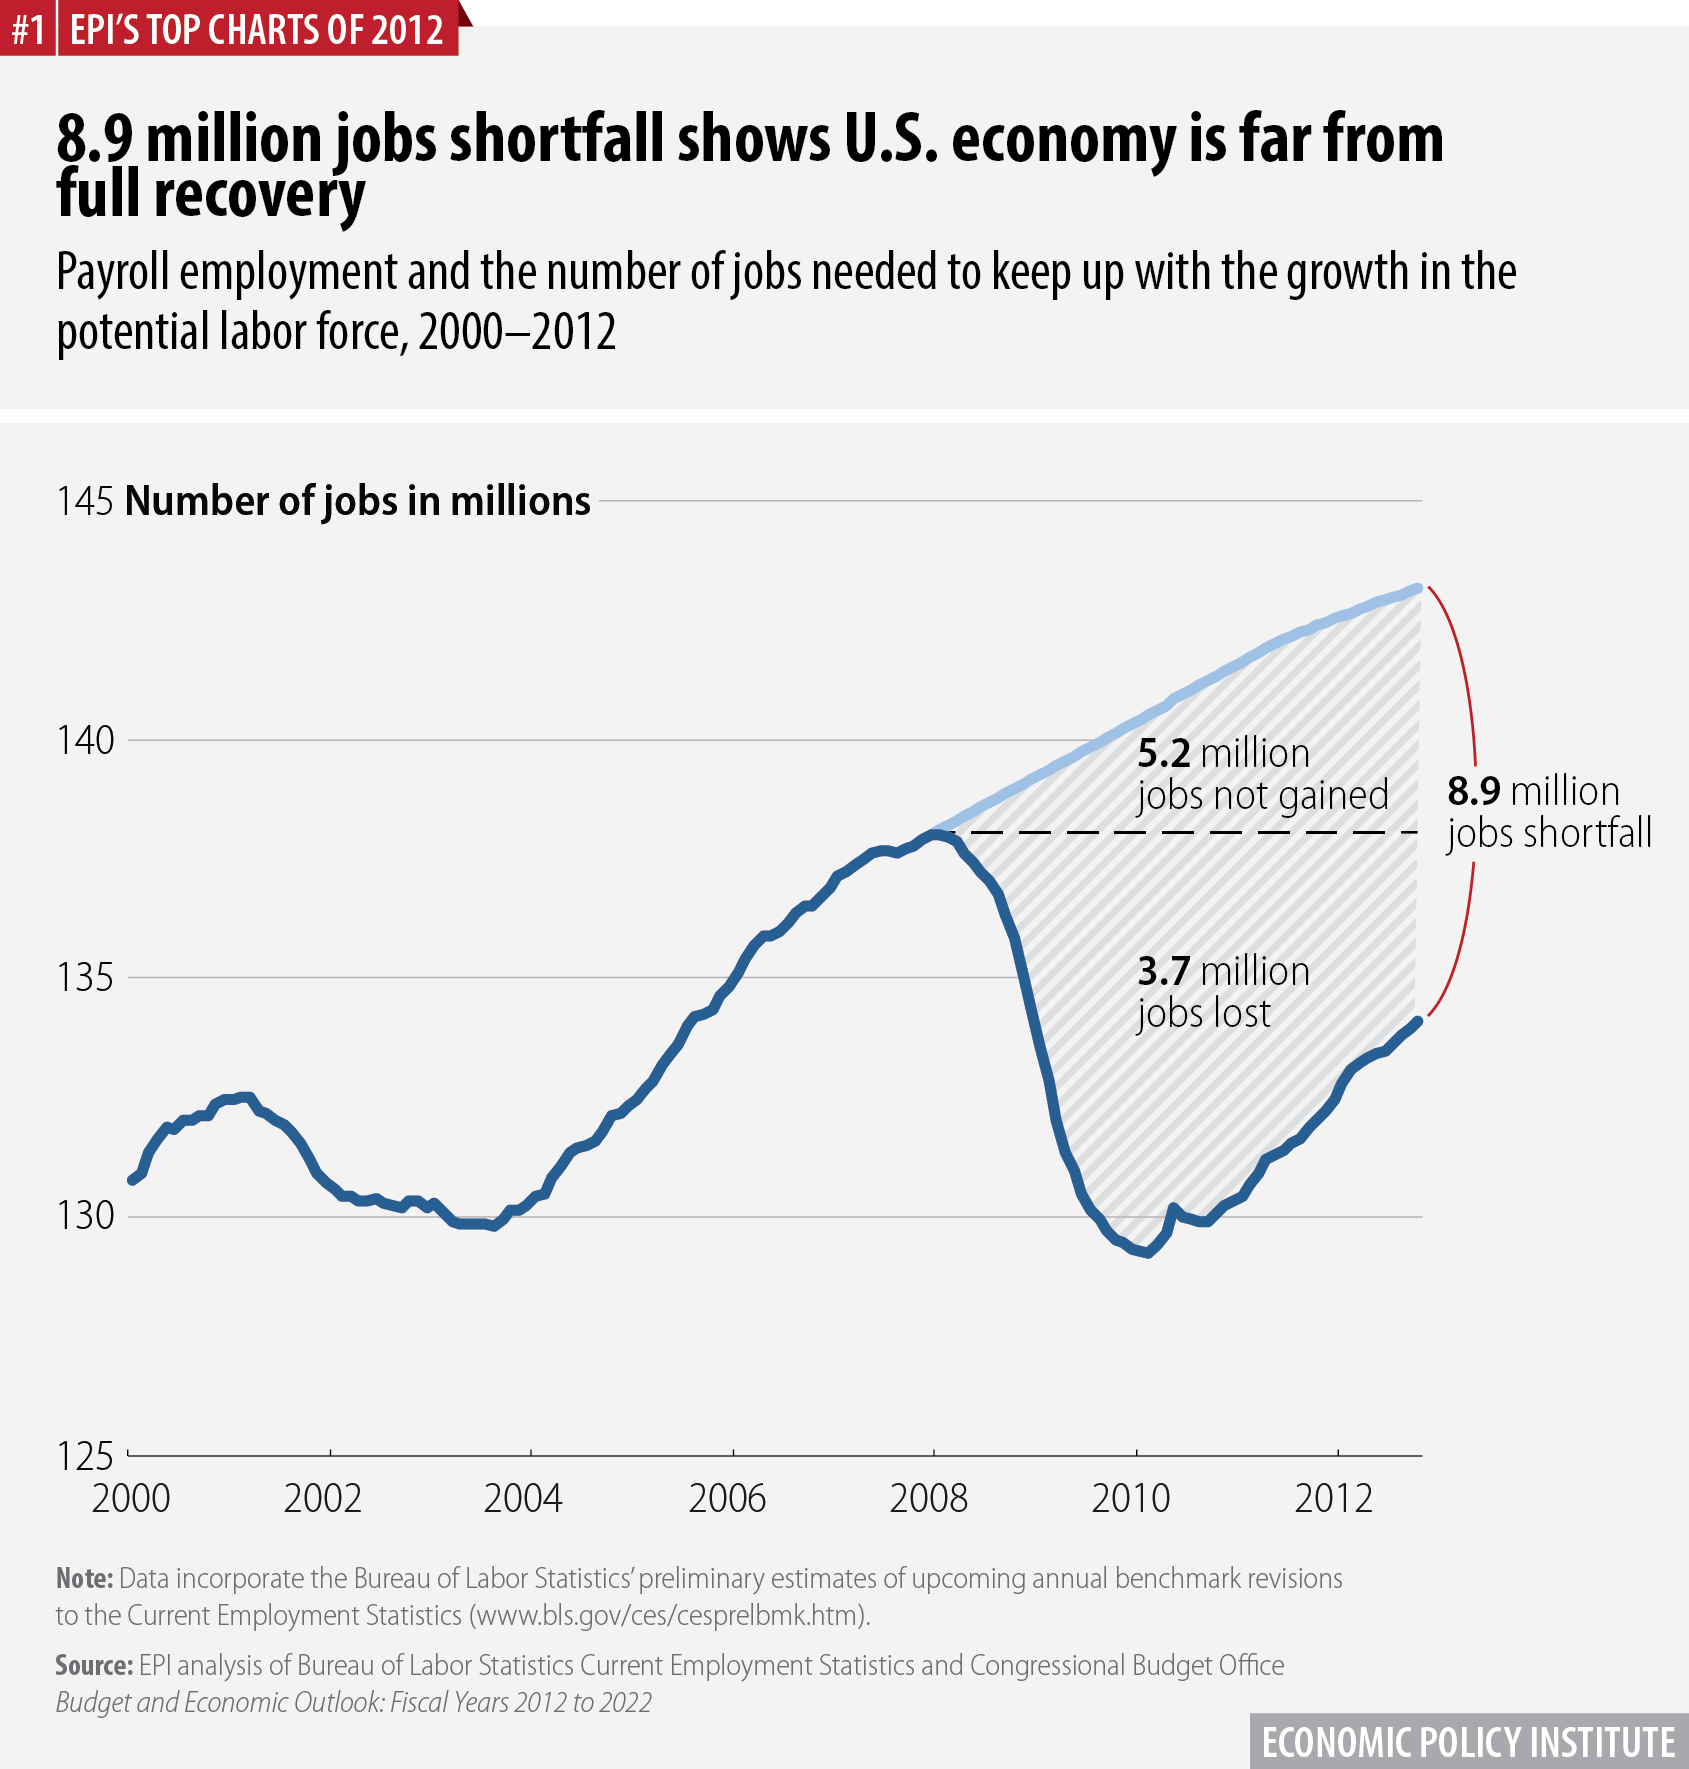
In November 2012, the labor market had 3.7 million fewer jobs than when the recession began in December 2007. And, because the potential labor force grows as the population expands, the economy should have added 5.2 million jobs since December 2007 just to keep the unemployment rate stable. Counting jobs lost and jobs that should have been added, the U.S. economy has a jobs shortfall of 8.9 million.
Adapted from “Recession has left in its wake a jobs shortfall of nearly 9 million,” an EPI Economic Indicator updated Dec. 7, 2012, on www.stateofworkingamerica.org
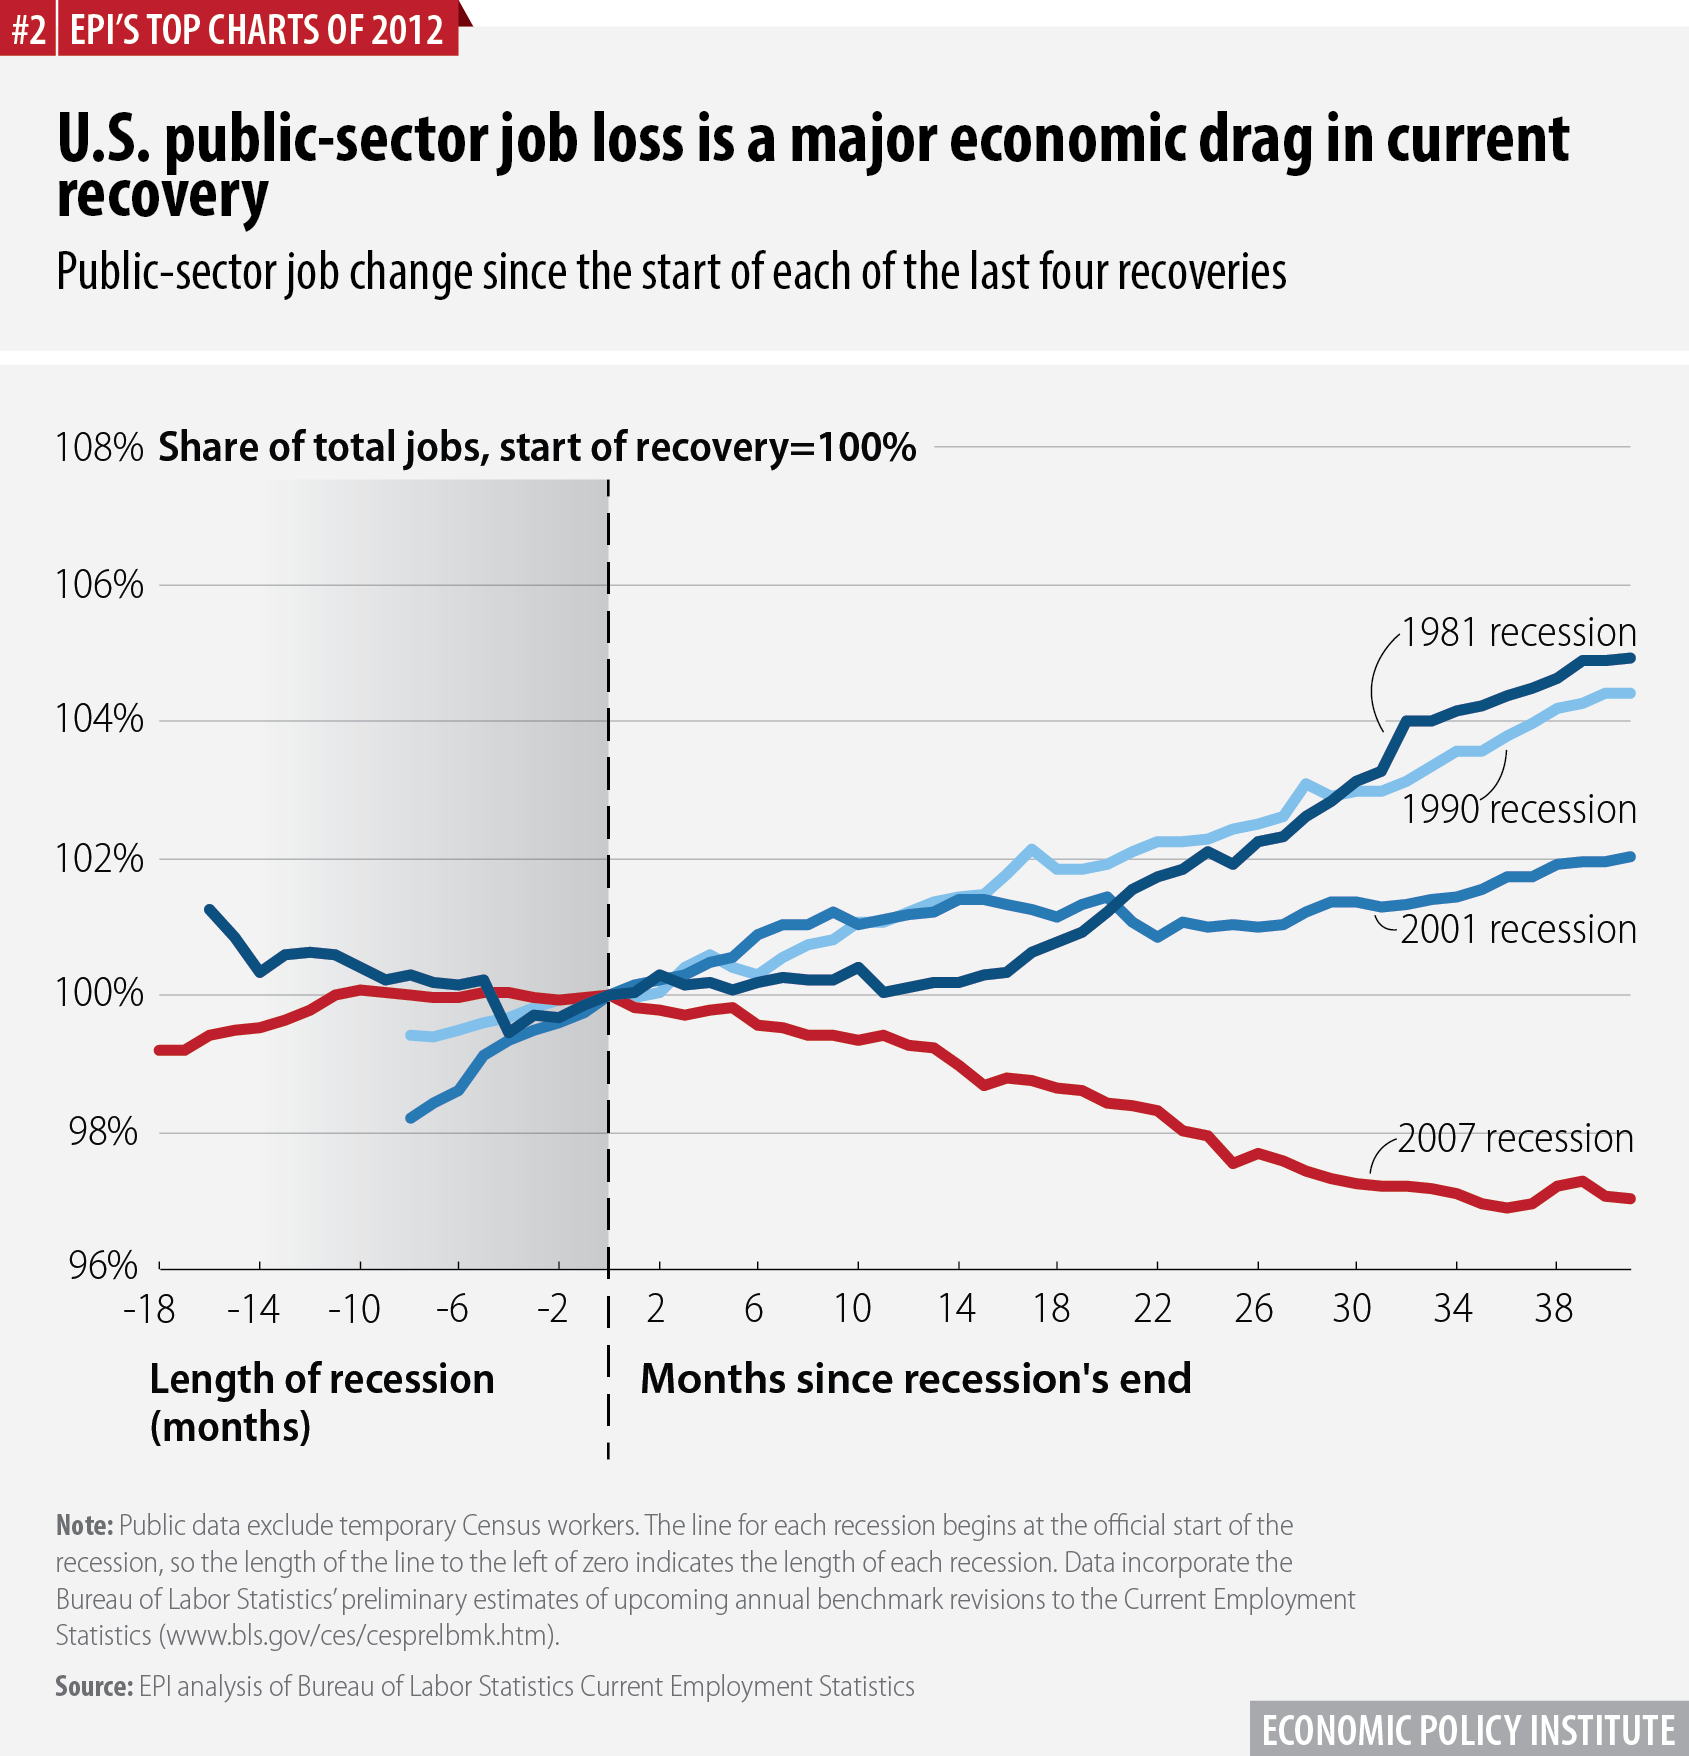
In the recoveries from the 1981, 1990, and 2001 recessions, public-sector jobs grew at a fairly steady pace. In the recovery from the 2007 recession, however, the public sector has seen massive job losses—a serious economic drag not present in earlier recoveries. Since the start of the recovery in June 2009, the public sector has lost 608,000 jobs. Through ripple effects, the loss of public-sector jobs also causes job loss in the private sector, amplifying the drain on the recovery. (For more background on public-sector job losses in the recovery, see “Three years into recovery, just how much has state and local austerity hurt job growth,” an EPI Working Economics blog post published July 6, 2012.)
Adapted from “Total job change for public-sector workers since the start of each of the last four recoveries,” an EPI Economic Indicator updated Dec. 7, 2012, on www.stateofworkingamerica.org.
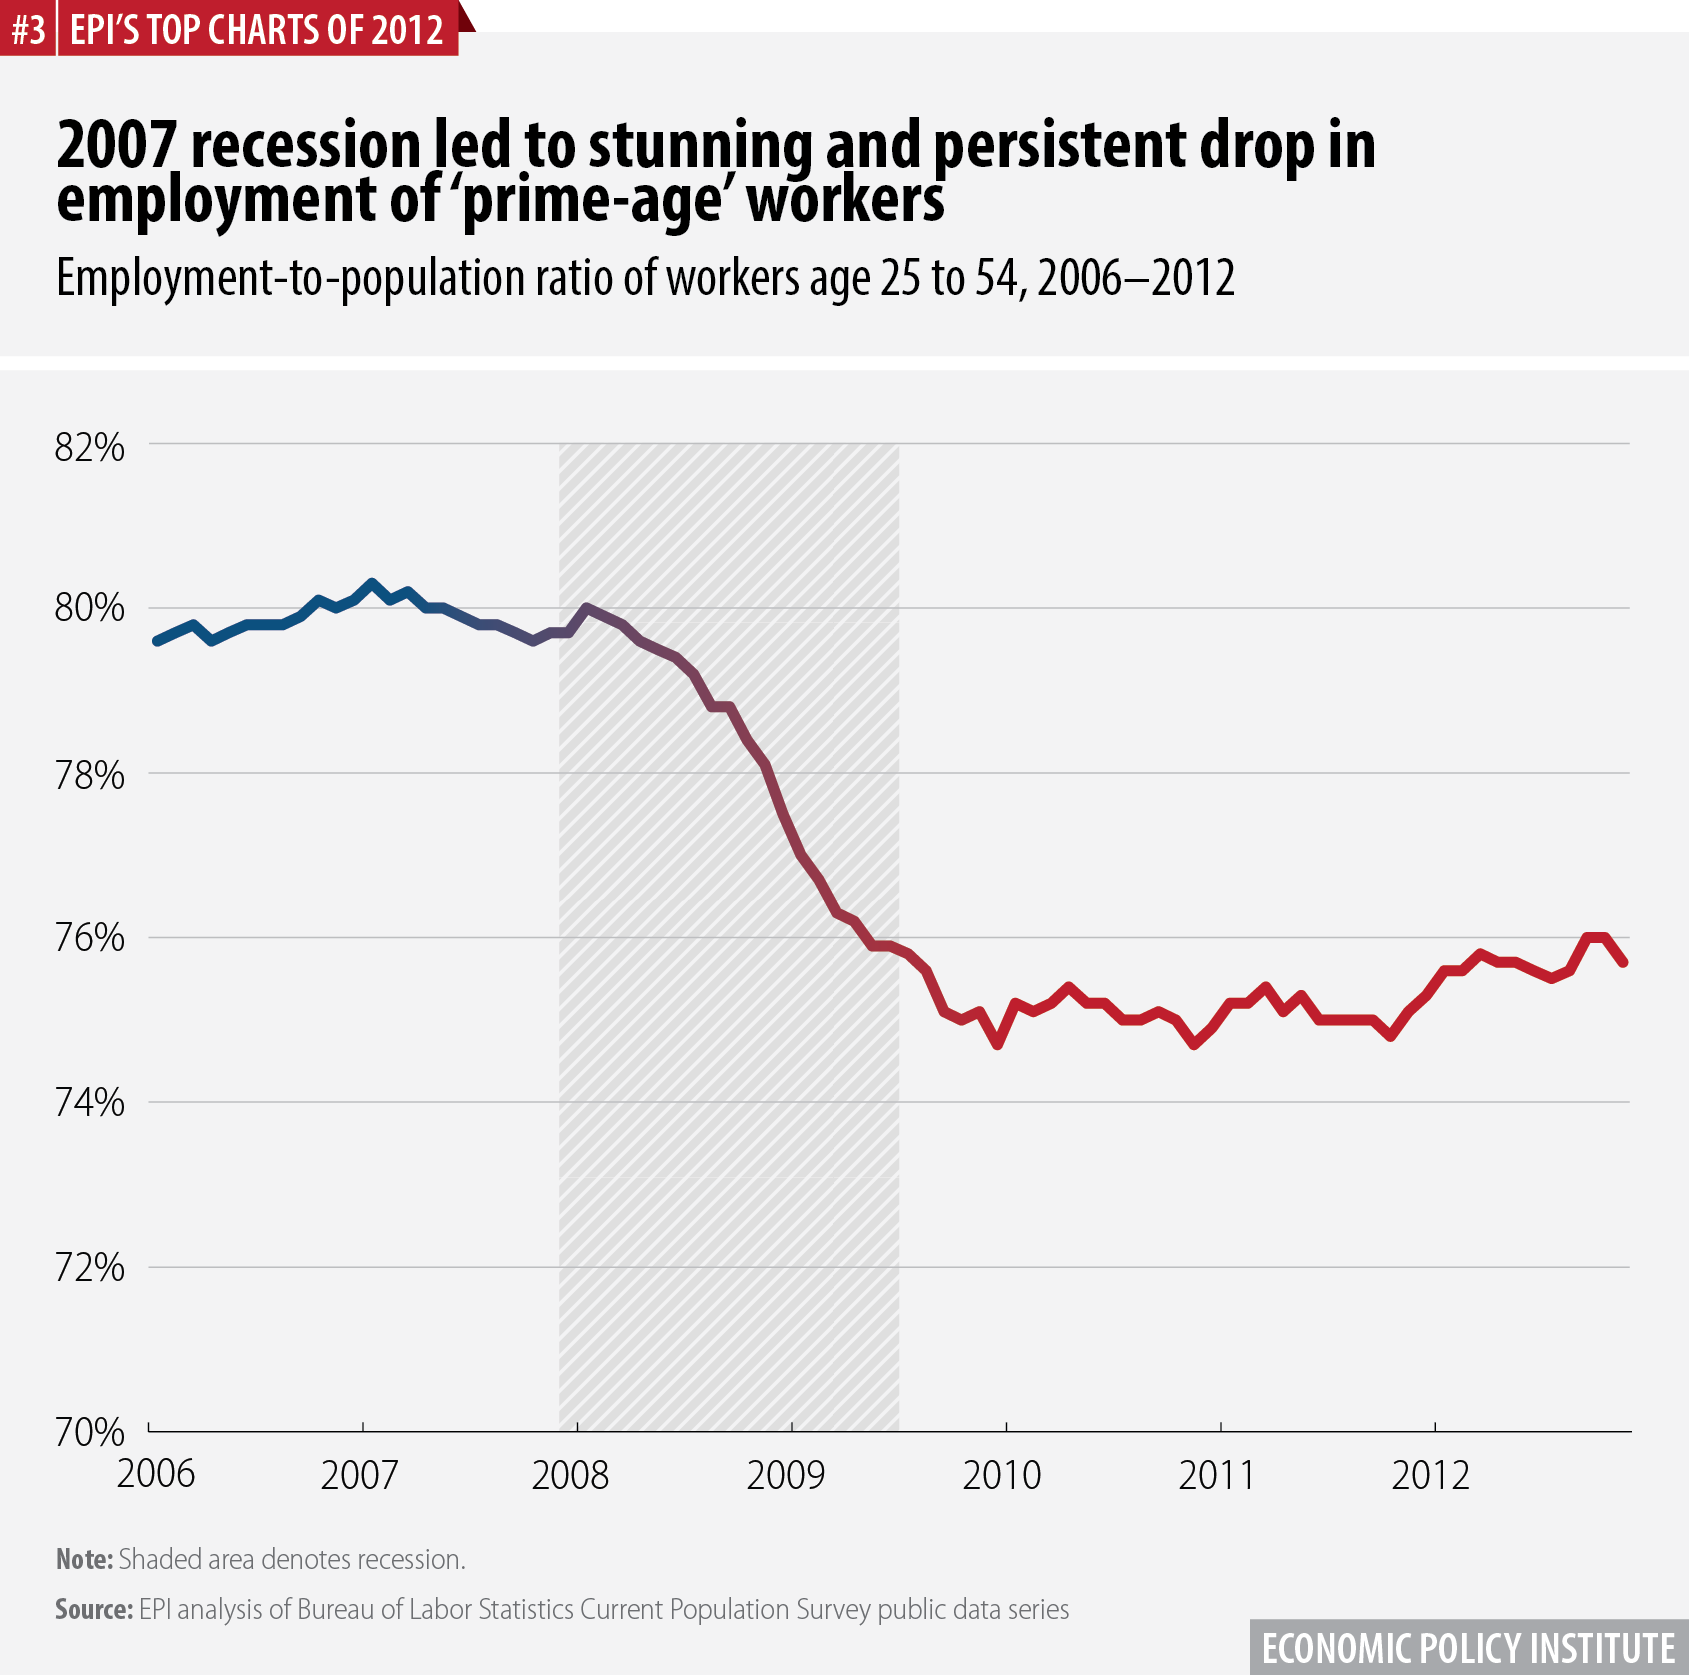
One of the best measures for assessing recent trends in job opportunities is the employment-to-population ratio of “prime-age” workers, which is simply the share of the age 25–54 population that has a job. (Looking at 25- to 54-year-olds instead of the entire working-age population provides more certainty that the trends we see are being driven by demand for workers and not by other factors, such as retiring baby boomers or increased college enrollment of young people.) As the figure shows, by this measure, U.S. labor market health deteriorated dramatically through late 2009, and then made essentially no progress for two years. Over the last year, the employment-to-population ratio of prime-age workers improved modestly, to 75.7 percent in November 2012, but is still far below its peak of 80.3 percent in January 2007.
Adapted from “Drop in employment for ‘prime-age’ workers during 2007 recession truly stunning,” an EPI Economic Indicator updated Dec. 7, 2012, on www.stateofworkingamerica.org
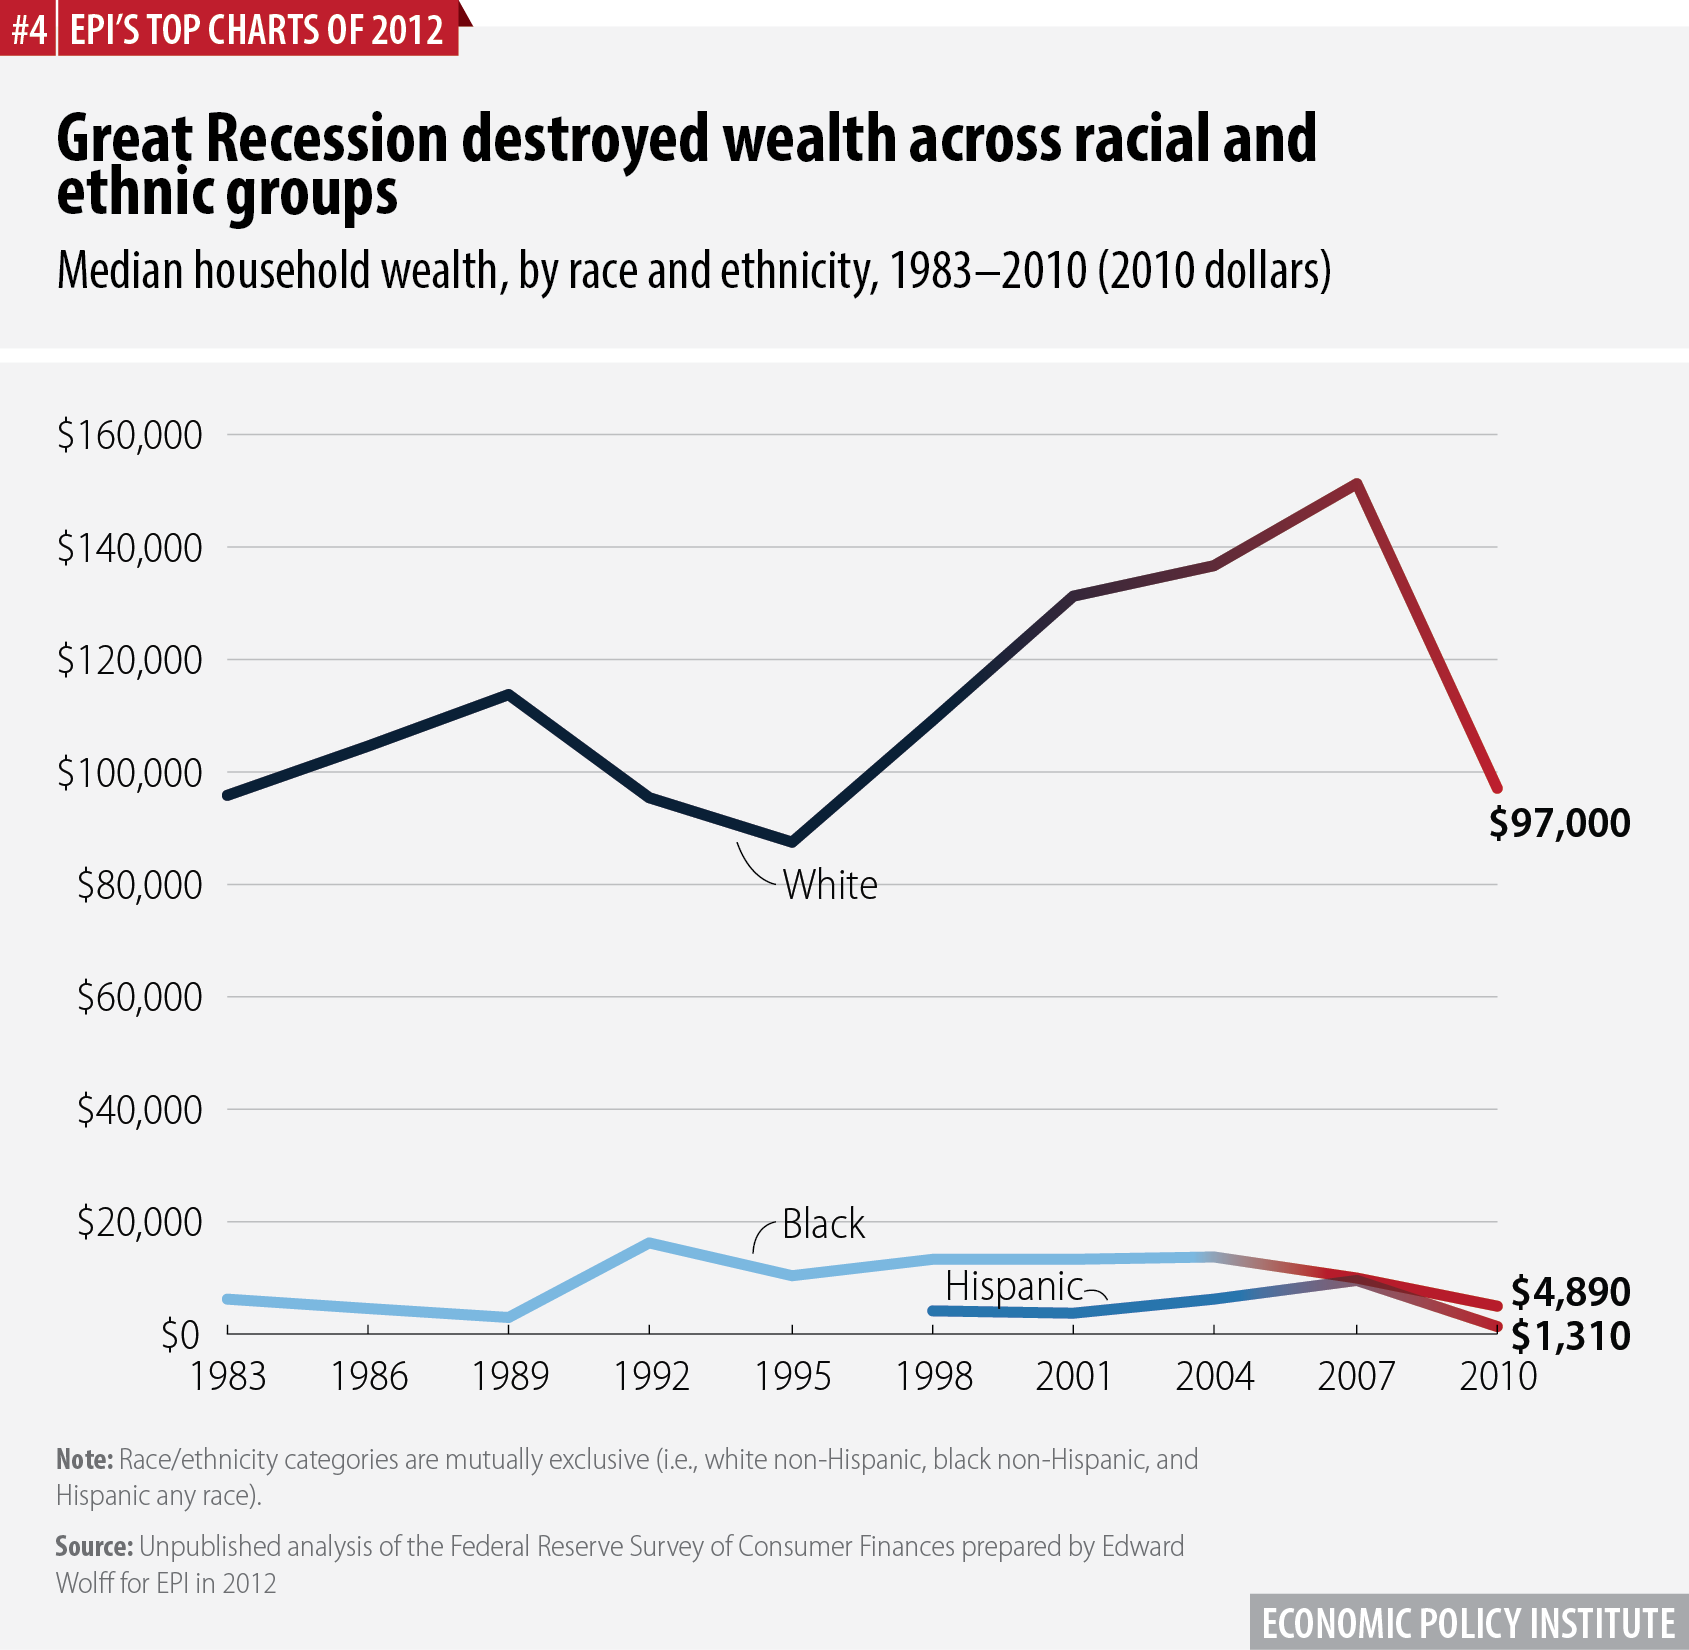
The massive destruction of household wealth by the housing bubble’s burst and resulting Great Recession affected all racial and ethnic groups. Between 2007 and 2010, median white household wealth declined 35.8 percent to $97,000, while median black household wealth dropped 49.7 percent to $4,890. And median Hispanic household wealth was all but wiped out over this period, dropping 86.3 percent to $1,310.
Adapted from The State of Working America, 12th Edition, Figure 6E
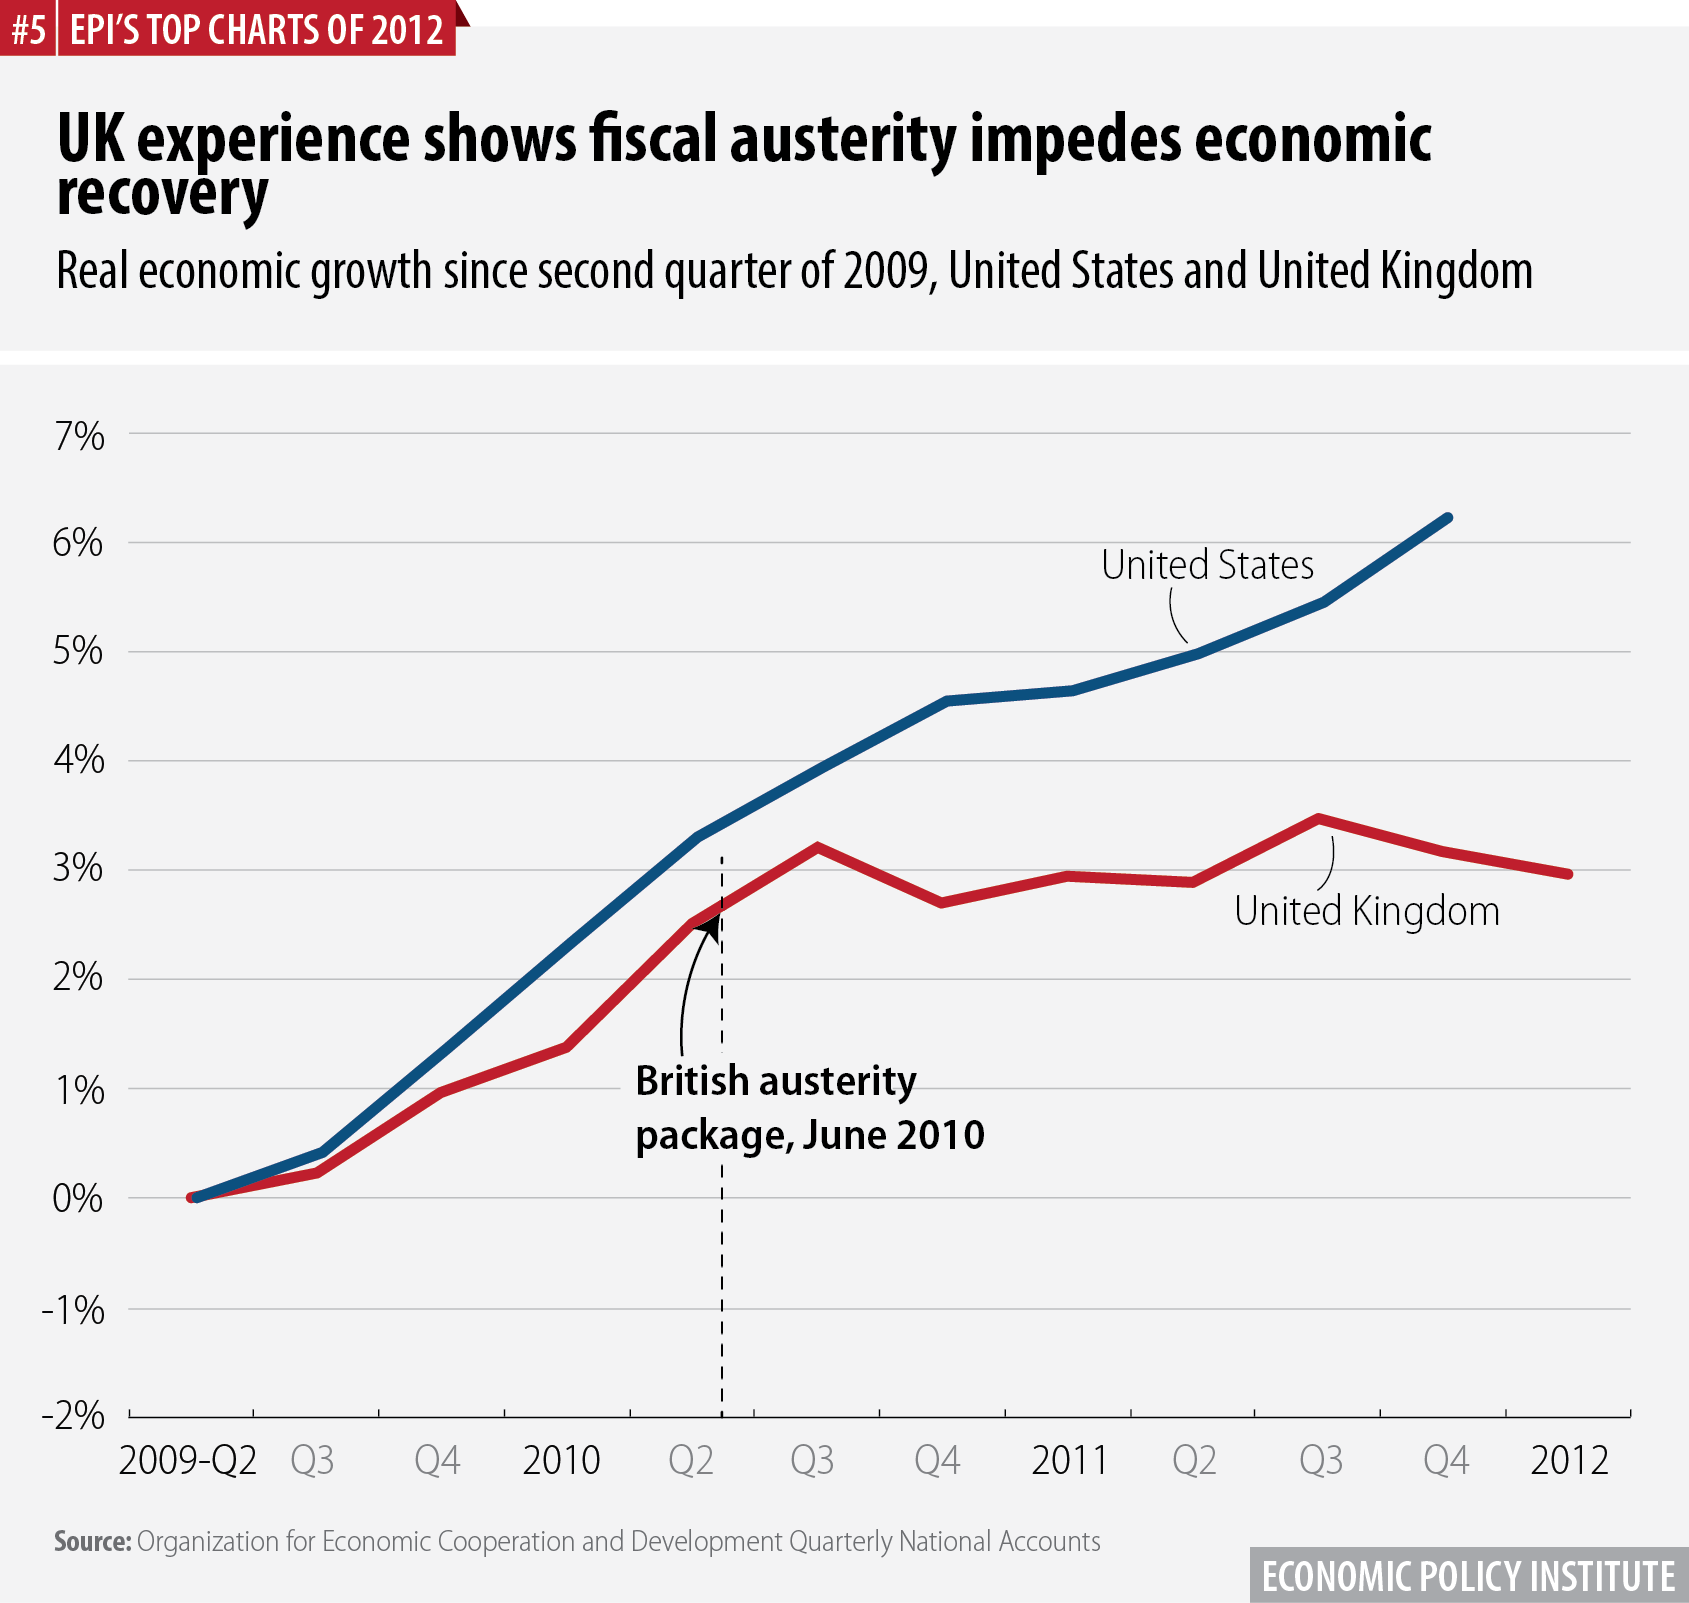
The United States and United Kingdom experienced similar rates of economic growth prior to the U.K.’s passage of an austerity budget in mid-2010. This budget caused U.K. economic growth to stagnate, while the U.S. economy continued on its trajectory of solid-if-not-stellar growth. If U.S. policymakers fail to counteract contractionary elements of current law in 2013, the United States’ trajectory will come to more closely resemble that of the United Kingdom.
Adapted from “A tale of two economies,” an EPI Economic Snapshot published April 26, 2012
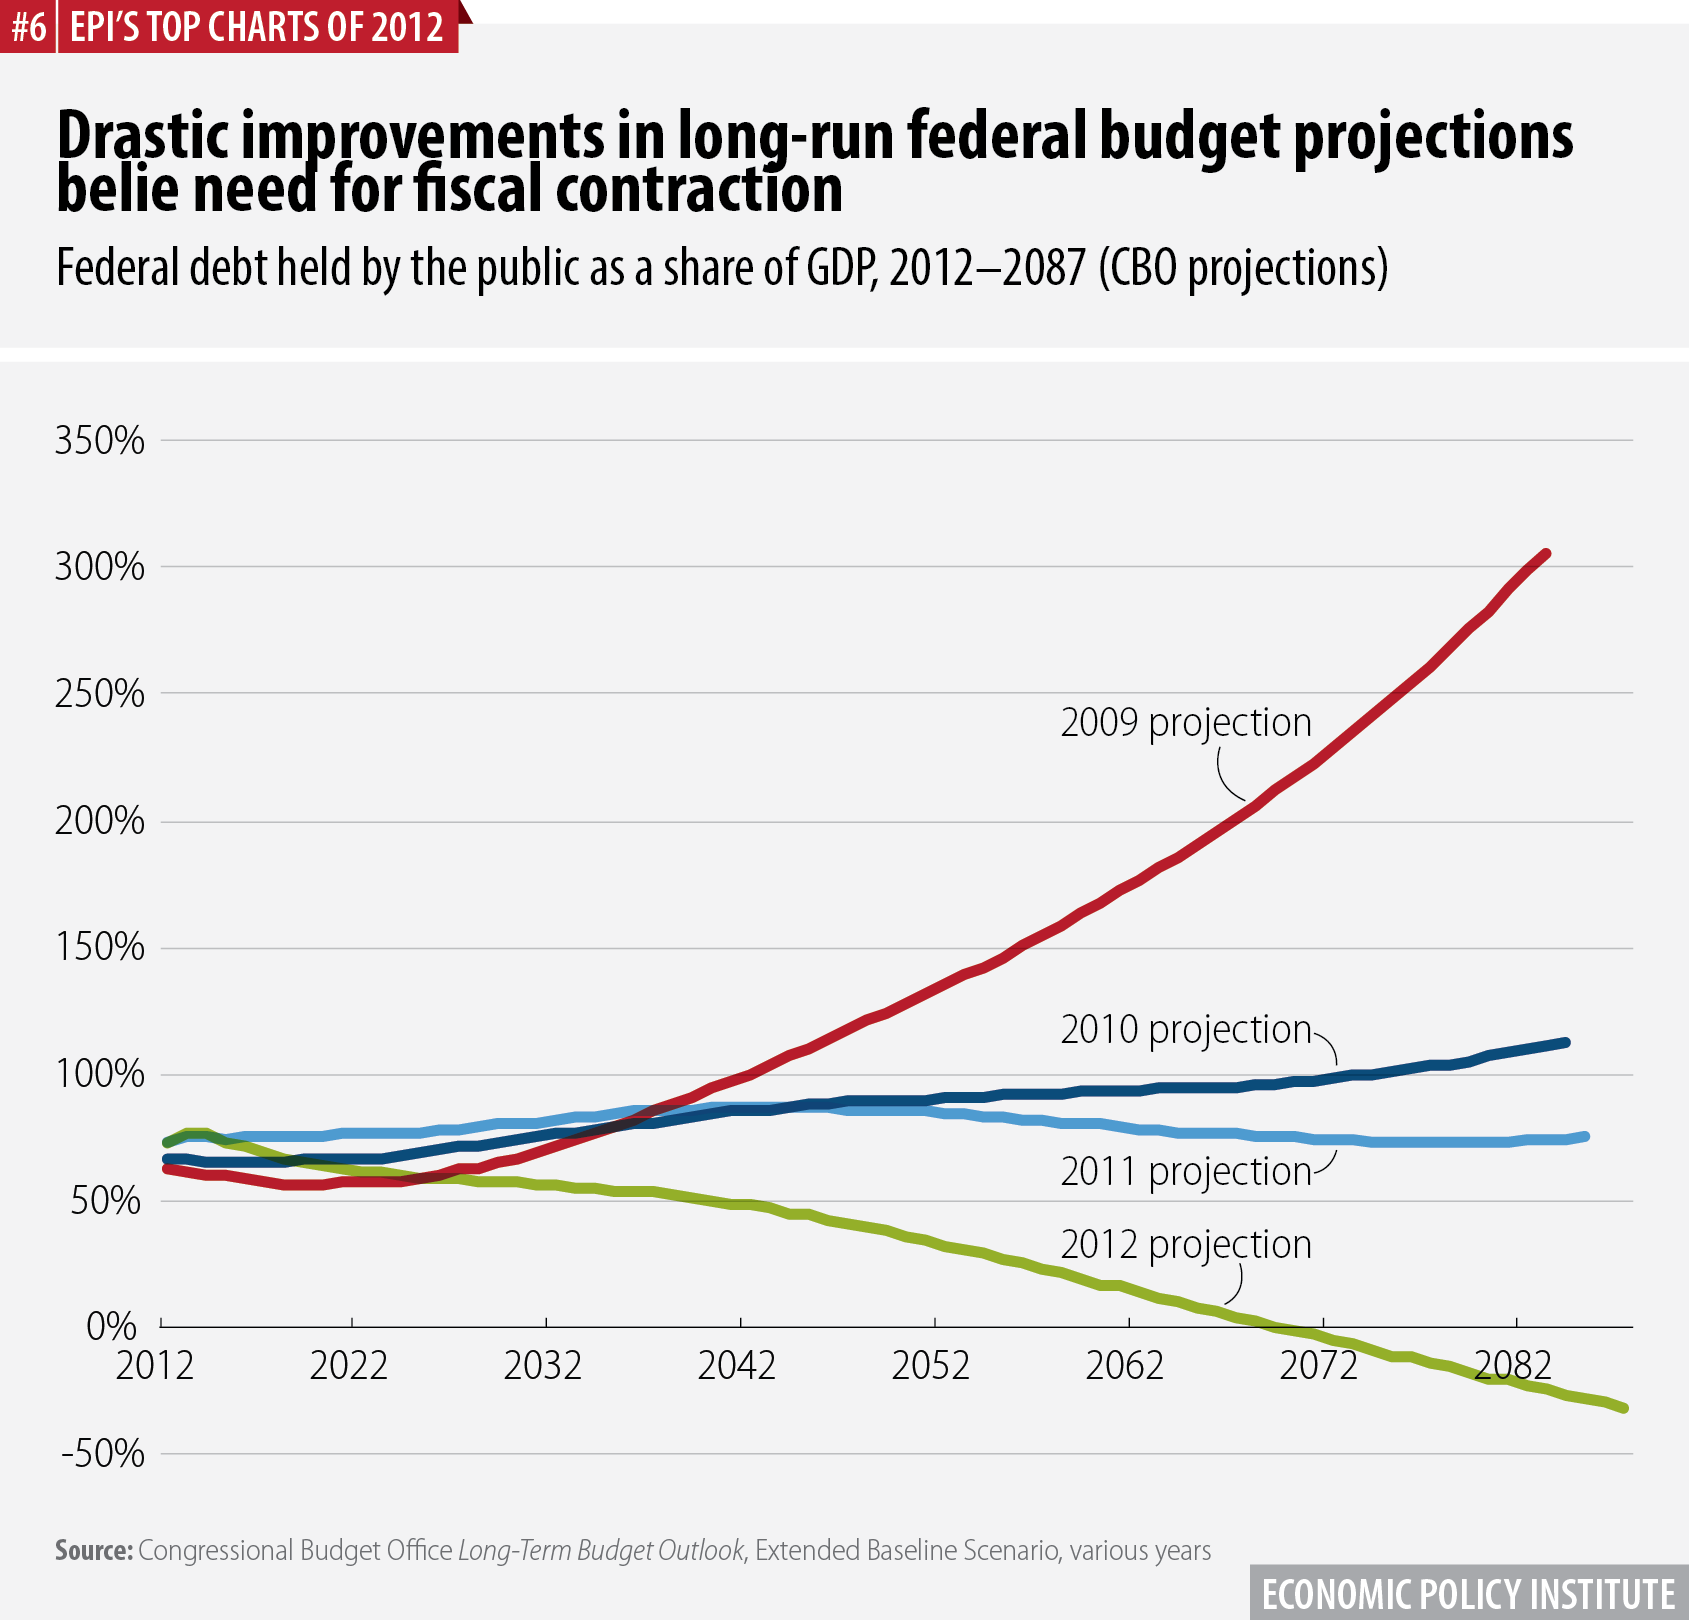
Over the last three years, the long-term budget outlook (covering 75 years) if current law is followed has improved dramatically. In 2009, the Congressional Budget Office projected that debt held by the public would rise from around 60 percent of GDP to roughly 300 percent of GDP in 75 years. In contrast, in 2012 the CBO has projected that debt will consistently fall—and even be fully paid off by 2070.
Adapted from “The long-term budget outlook has improved dramatically over the last three years,” an EPI Working Economics blog post published June 6, 2012
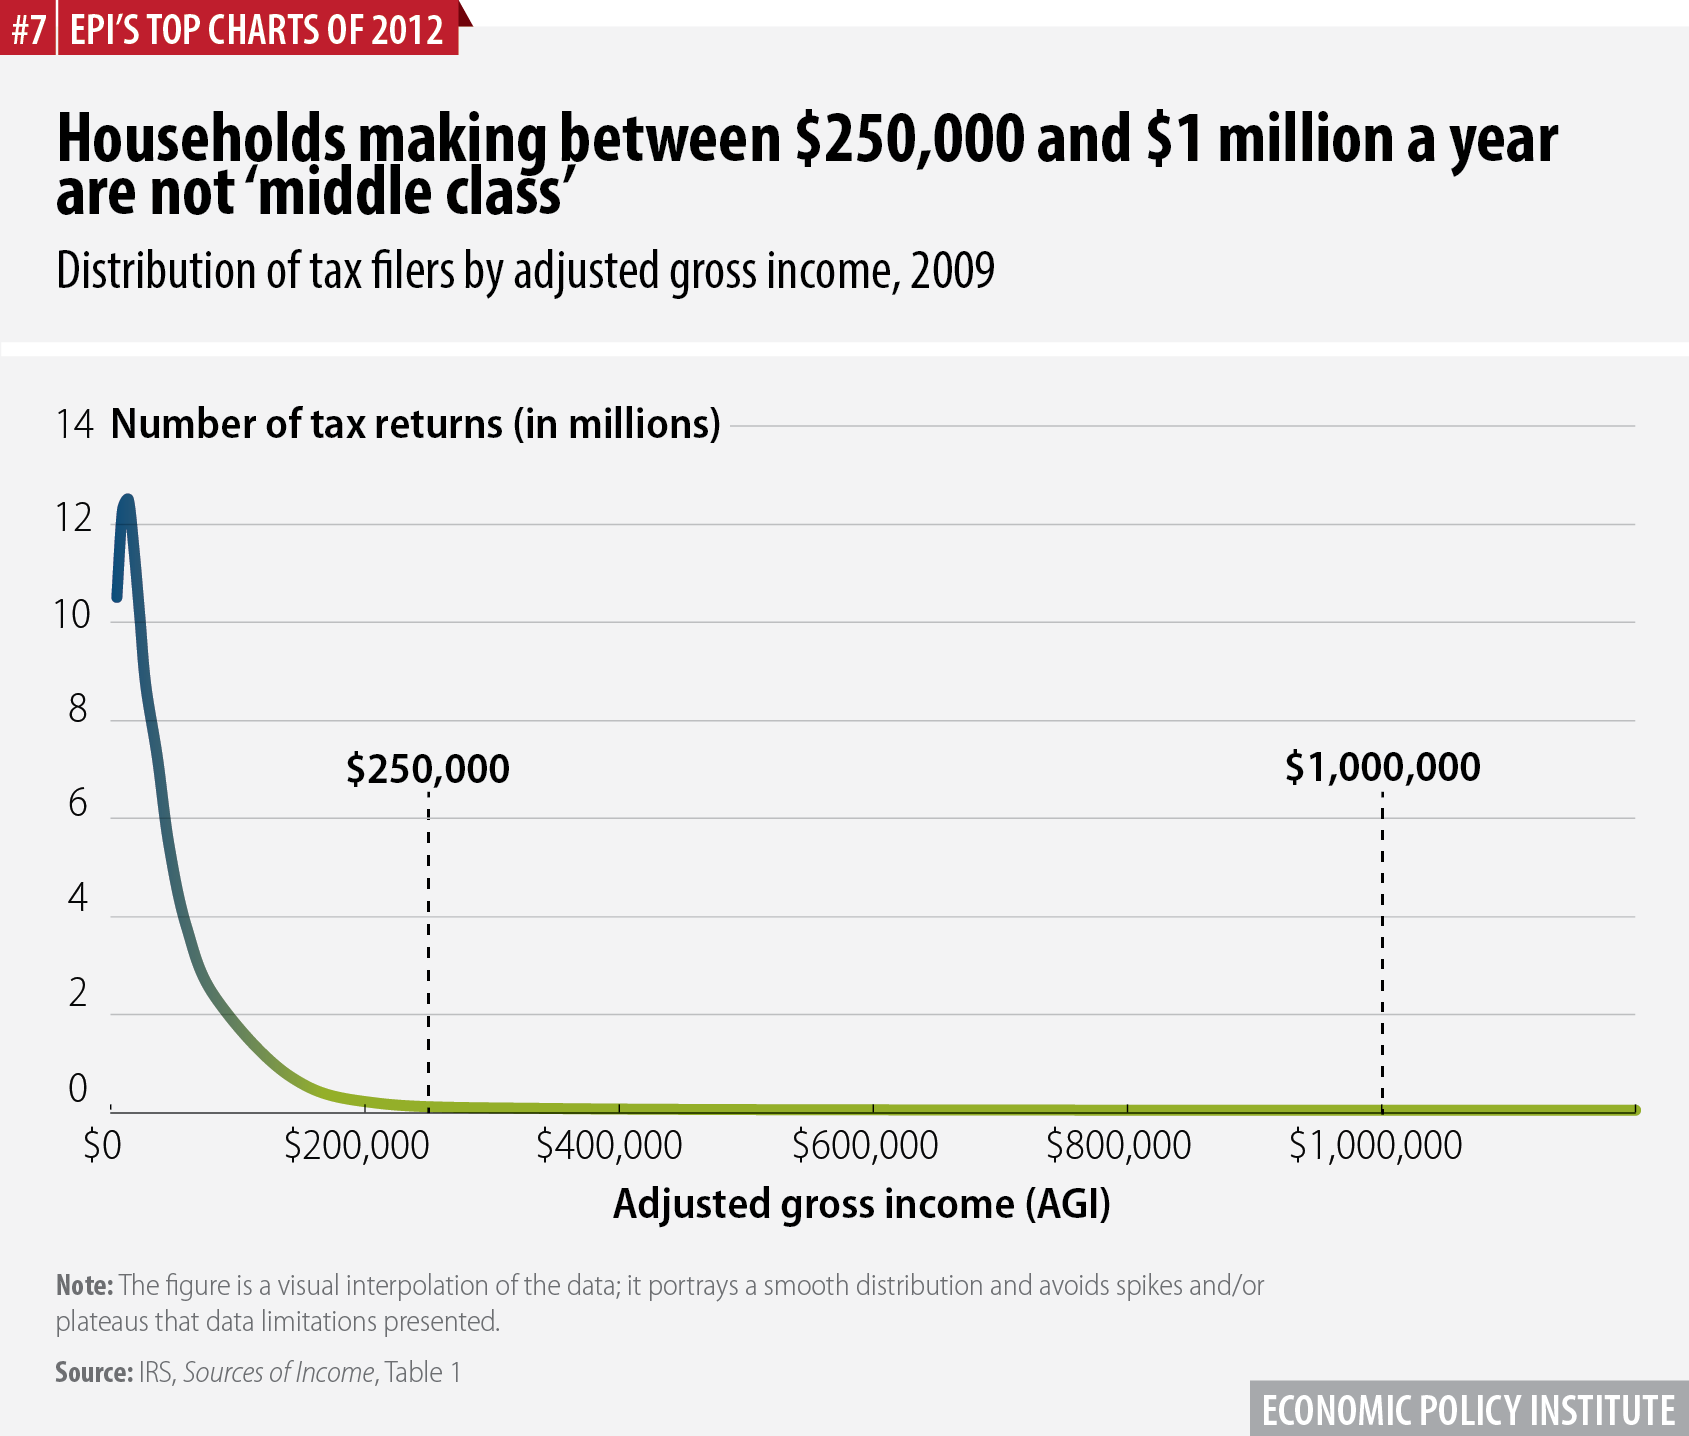
The current debate about the pending expiration of the Bush-era tax cuts has generated claims that the middle class will suffer under the administration’s proposal to end cuts for taxpayers in the top two income-tax brackets (married taxpayers with income over $250,000 and singles with income over $200,000). But as this graph shows, taxpayers making between $250,000 and $1 million are not “middle class,” as the vast majority of taxpayers make under $250,000. Indeed, according to IRS data, more than 87 percent of taxpayers make less than $100,000. Wherever on the income scale the American middle class begins and ends, raising the income threshold to allow higher-income Americans to receive tax cuts has nothing to do with protecting the middle class.
Adapted from “Households making between $250K and $1M a year are not ‘middle class,’” an EPI Economic Snapshot published June 13, 2012
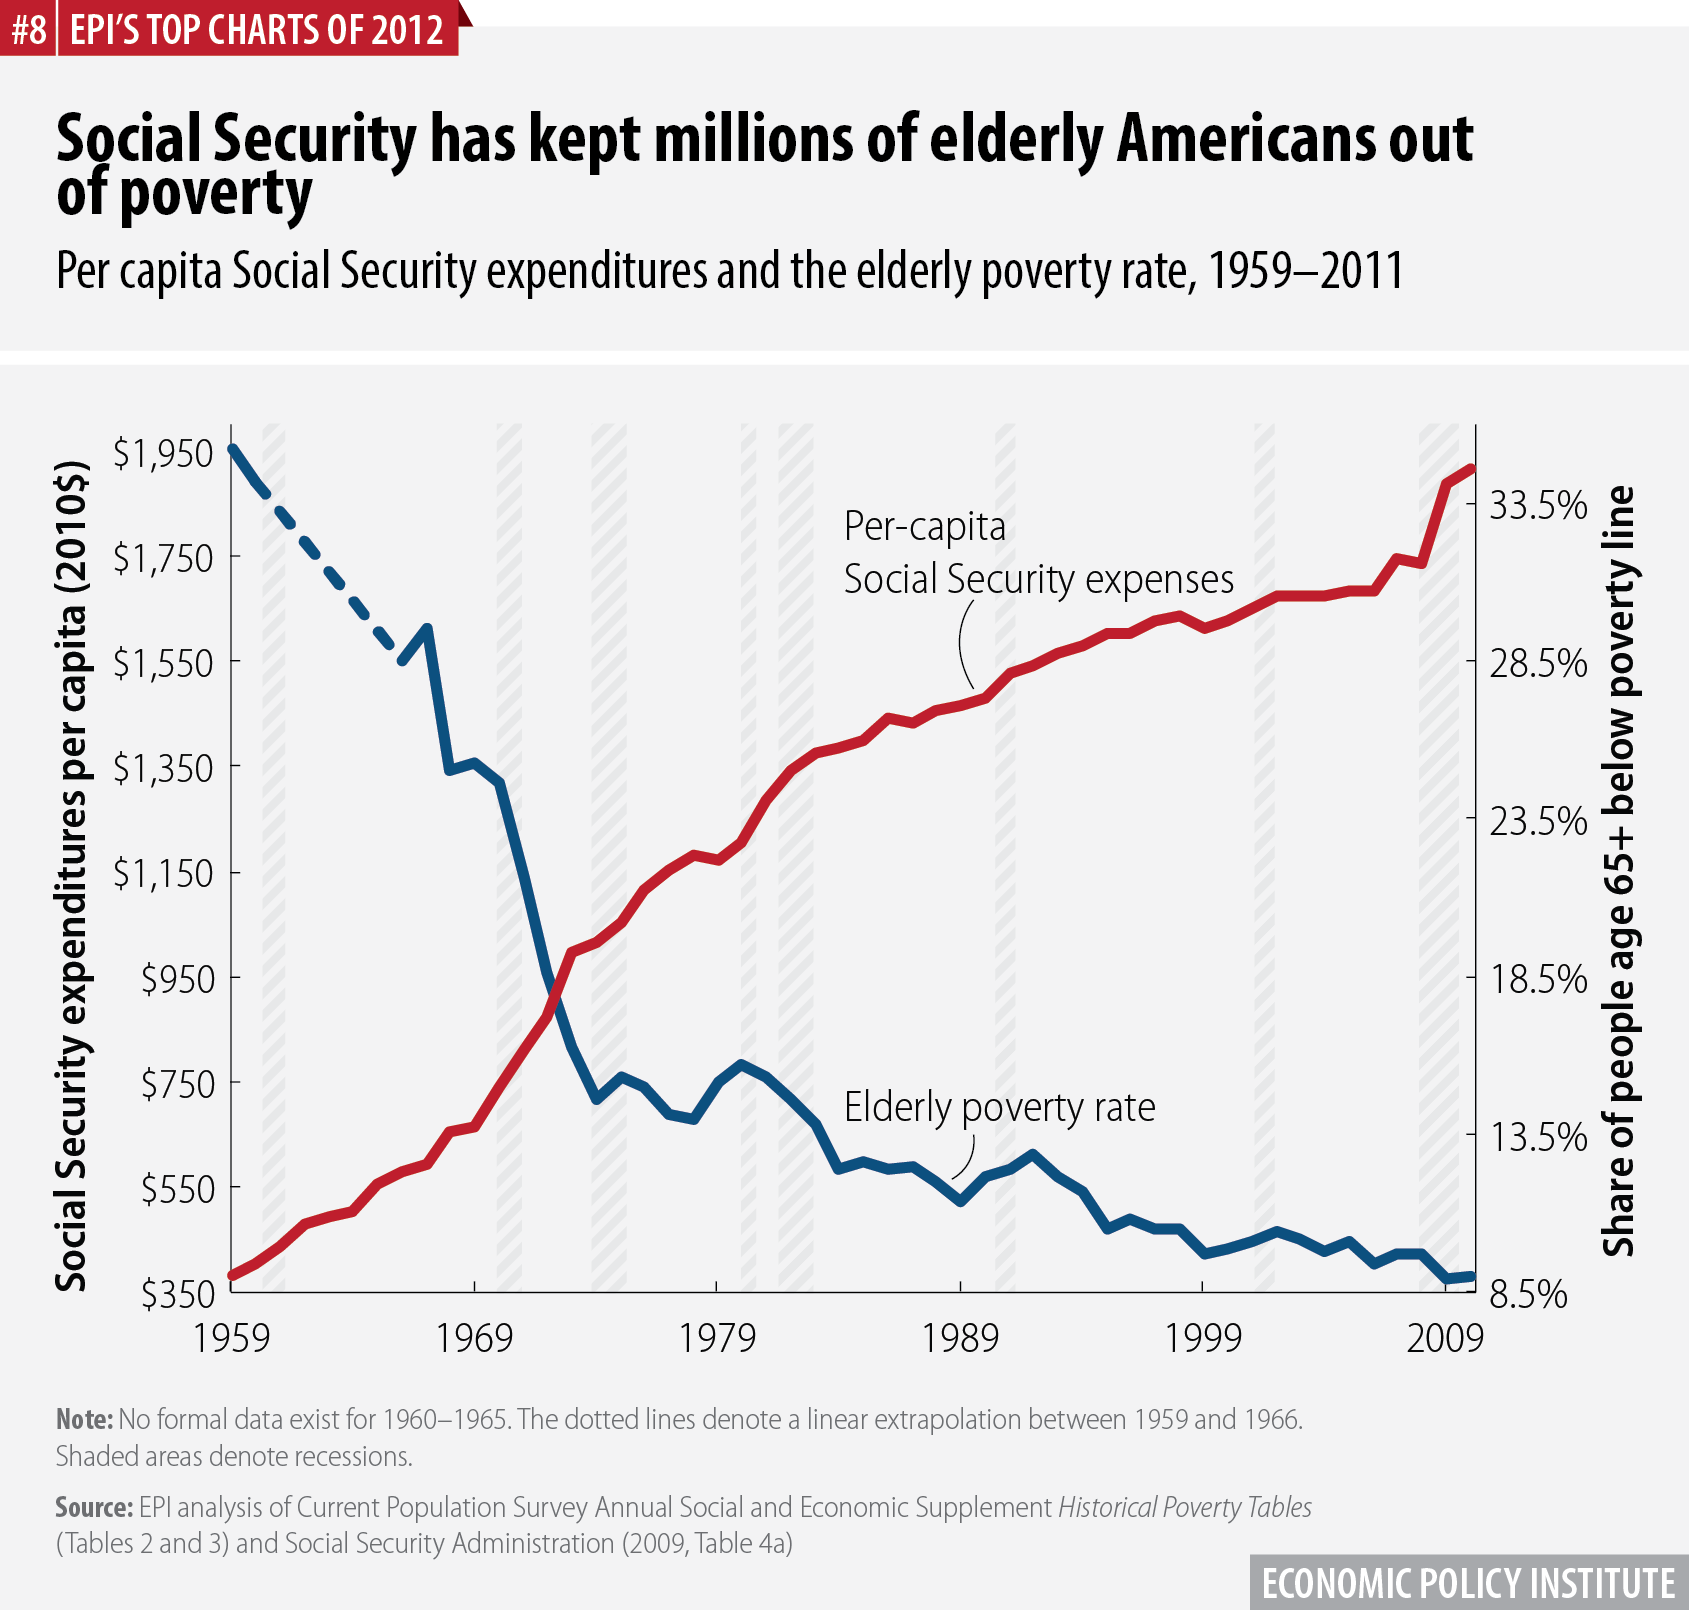
In debates over the federal budget, Social Security is too often treated in strictly accounting terms or as a bargaining chip. But as this graph shows, the human consequences of Social Security are profound. It demonstrates that declines in elderly poverty in recent decades are directly associated with sharp increases in per capita Social Security expenditures. The program has lifted tens of millions of Americans (mostly the elderly) out of poverty, just as it was intended to do.
Adapted from The State of Working America, 12th Edition, Figure 7R
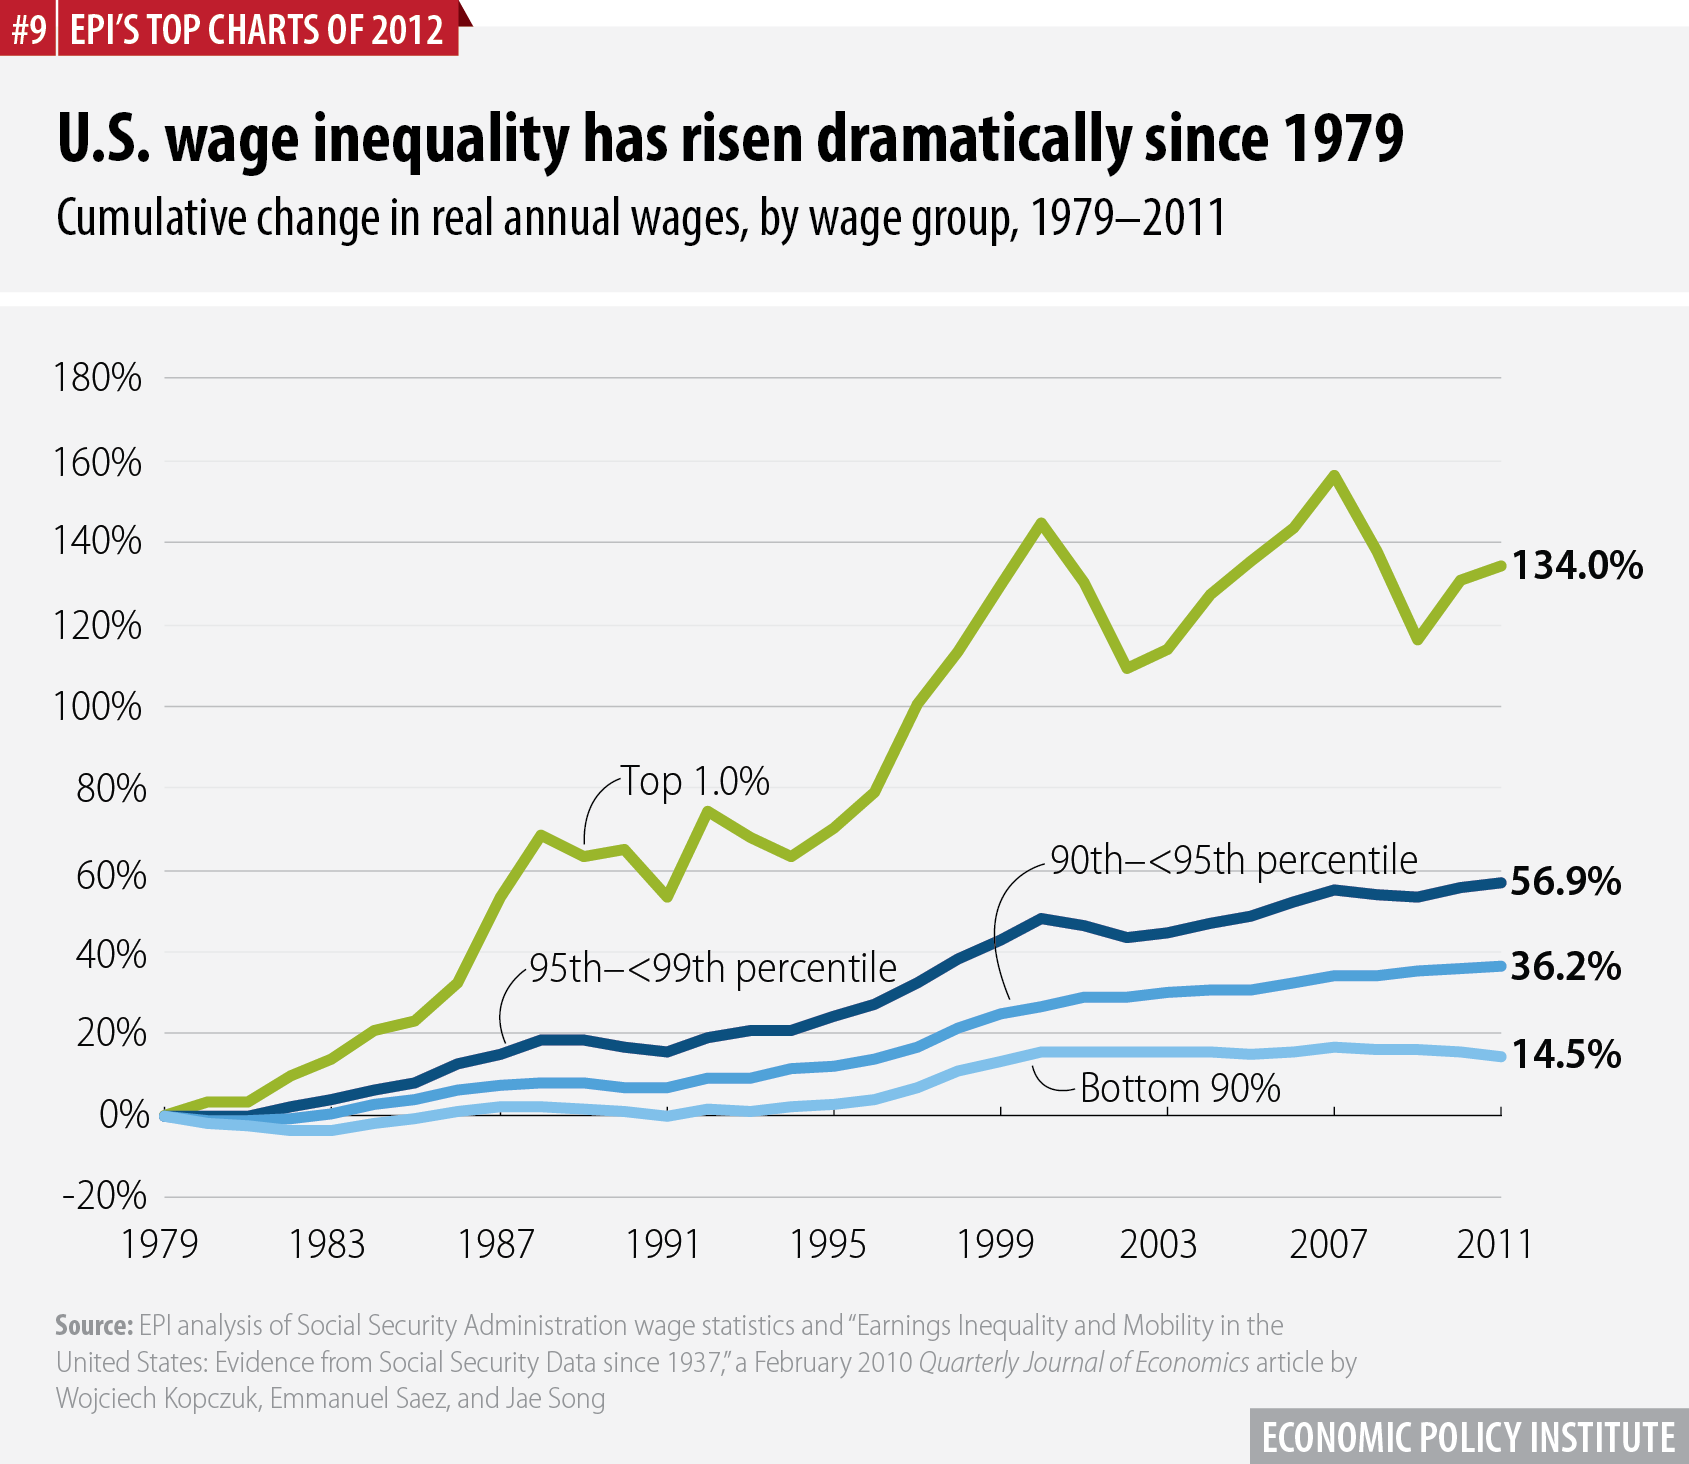
Current debates over which segments of the population should face higher taxes as a part of deficit-cutting efforts should be informed by an understanding of who has benefited disproportionately in the economy of the past decades. From 1979 to 2011, inflation-adjusted annual wages of the top 1.0 percent of wage earners grew 134.0 percent—while wages of the bottom 90 percent of the wage distribution grew just 14.5 percent.
Adapted from The State of Working America, 12th Edition, Figure 4H
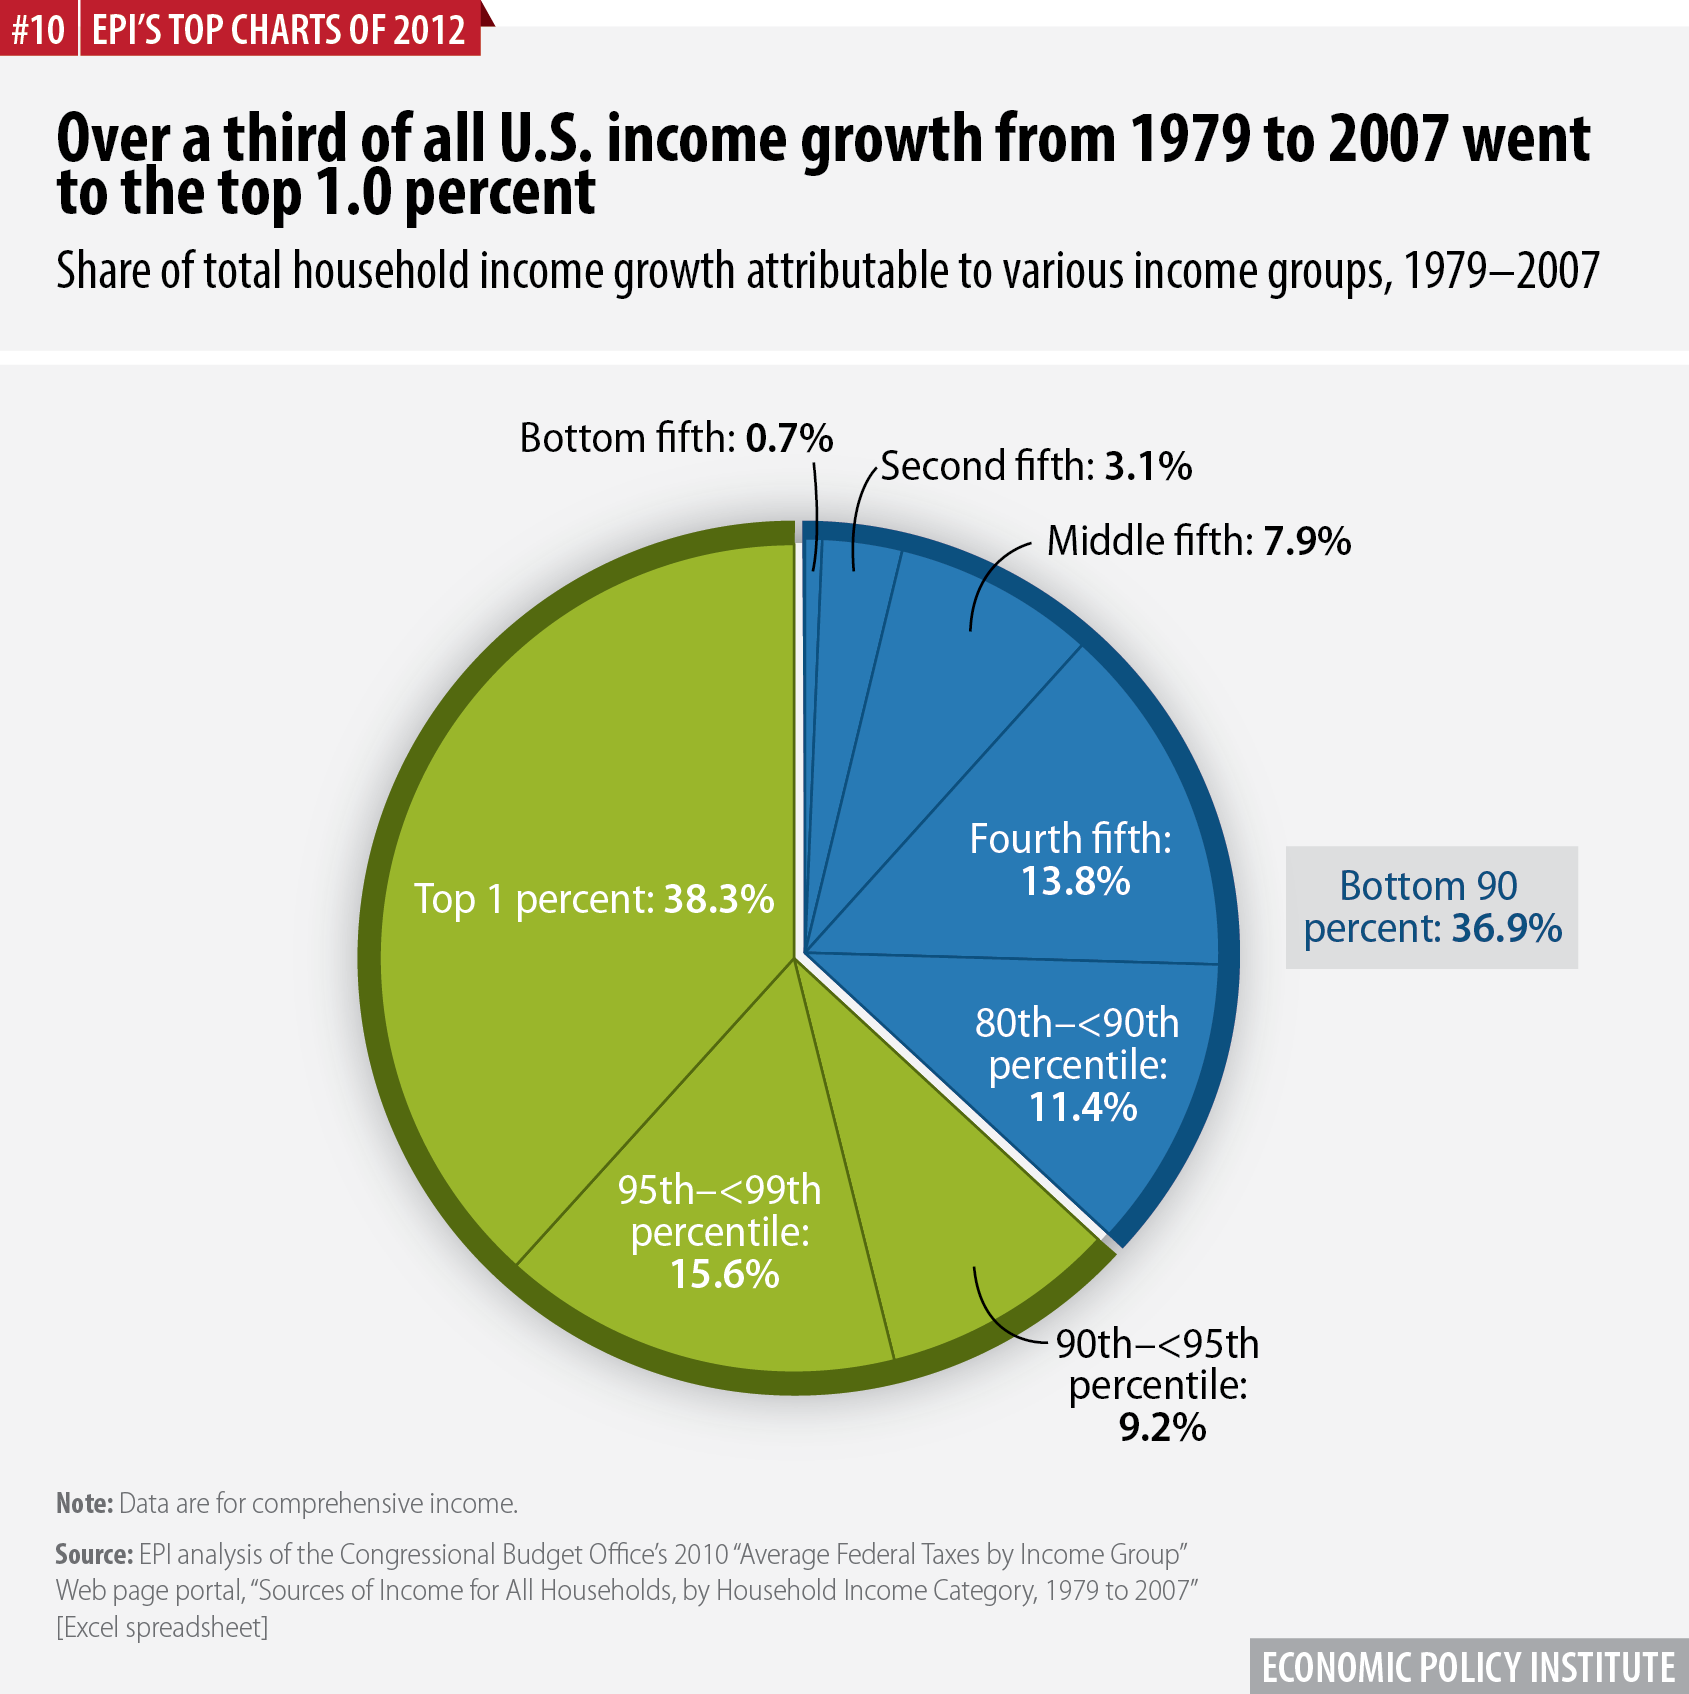
Households at the top accounted for much of the overall income growth in the U.S. economy between 1979 and 2007, the last year before the Great Recession. The top 1.0 percent of households accounted for 38.3 percent of total average income growth in this period, more than the share accounted for by the entire bottom 90 percent, which was 36.9 percent.
Adapted from The State of Working America, 12th Edition, Figure 2Y
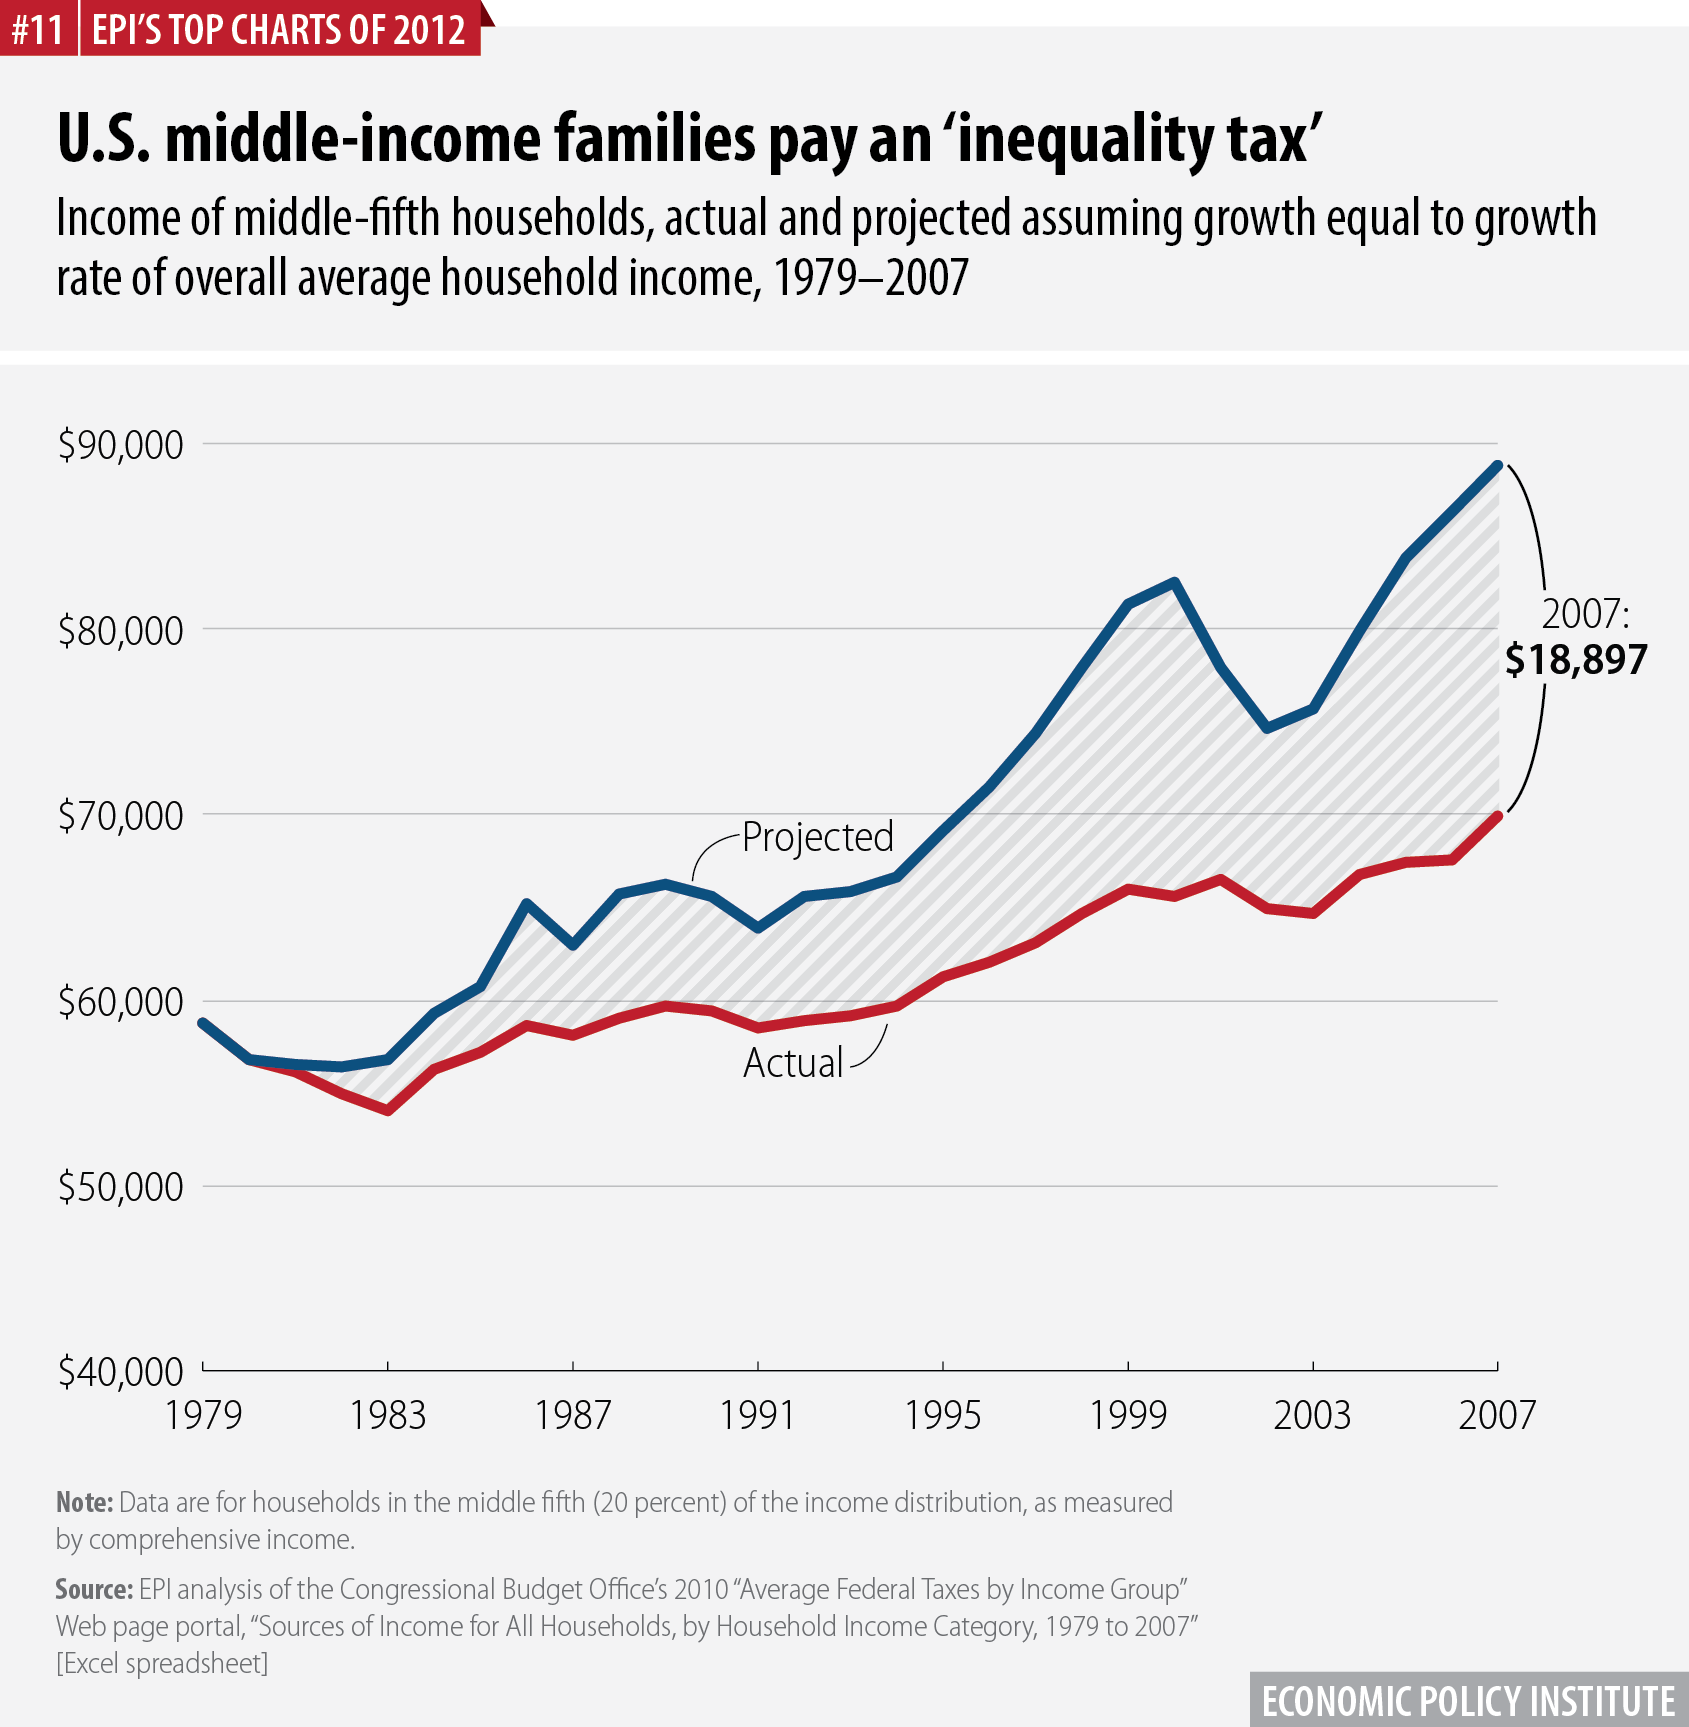
This graph puts a price tag on what rising inequality has cost middle-income families. It shows actual household income growth for the middle 20 percent of households, as well as what their income would have been had it grown at the overall average growth rate—a rate buoyed by extraordinarily rapid growth at the top. The upshot: Had incomes of these middle-income families simply grown at the average rate (i.e., had inequality not risen) from 1979 to 2007, their average household income in 2007 would have been nearly $19,000 higher—a 27 percent increase. Essentially, rising inequality imposed a tax of 27 percent on middle-fifth household incomes over this period.
Adapted from The State of Working America, 12th Edition, Figure 1K
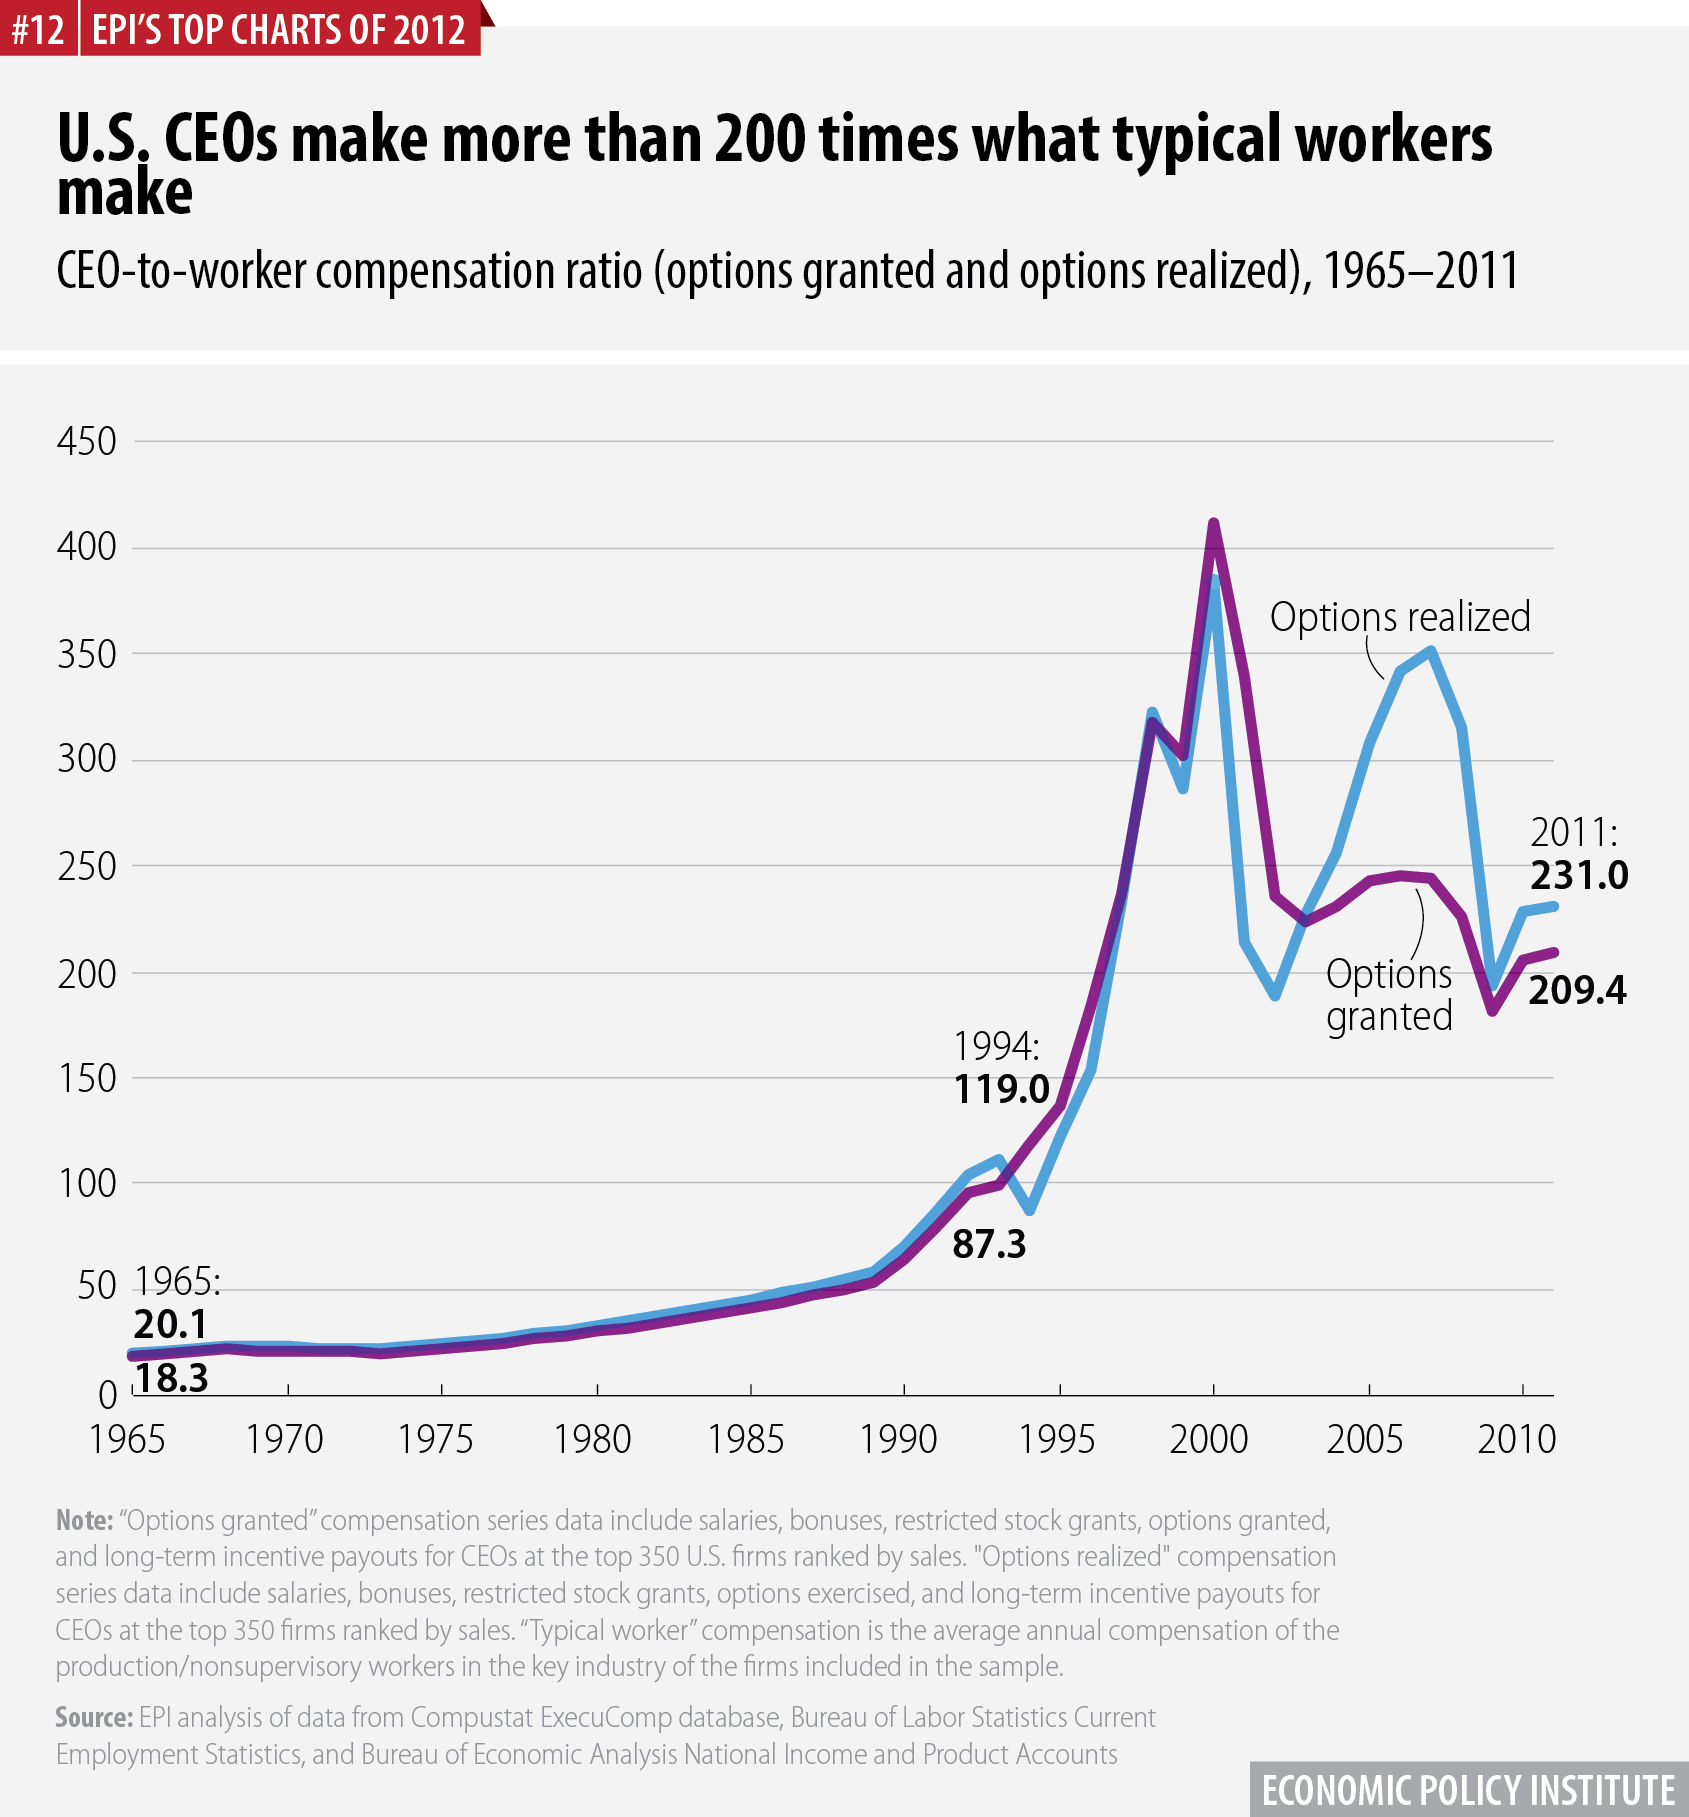
One of the more intuitive metrics of inequality is the ratio of CEO pay to typical worker pay. In 2011, the CEO-to-worker compensation ratio was 231.0-to-1 (including options realized) or 209.4-to-1 (including options granted). This is lower than at other times in the last 10 or 15 years, but still far above the ratio in 1994 (119.0-to-1 or 87.3-to-1) and prior years back to 1965 (20.1-to-1 or 18.3-to-1).
Adapted from The State of Working America, 12th Edition, Figure 4AH
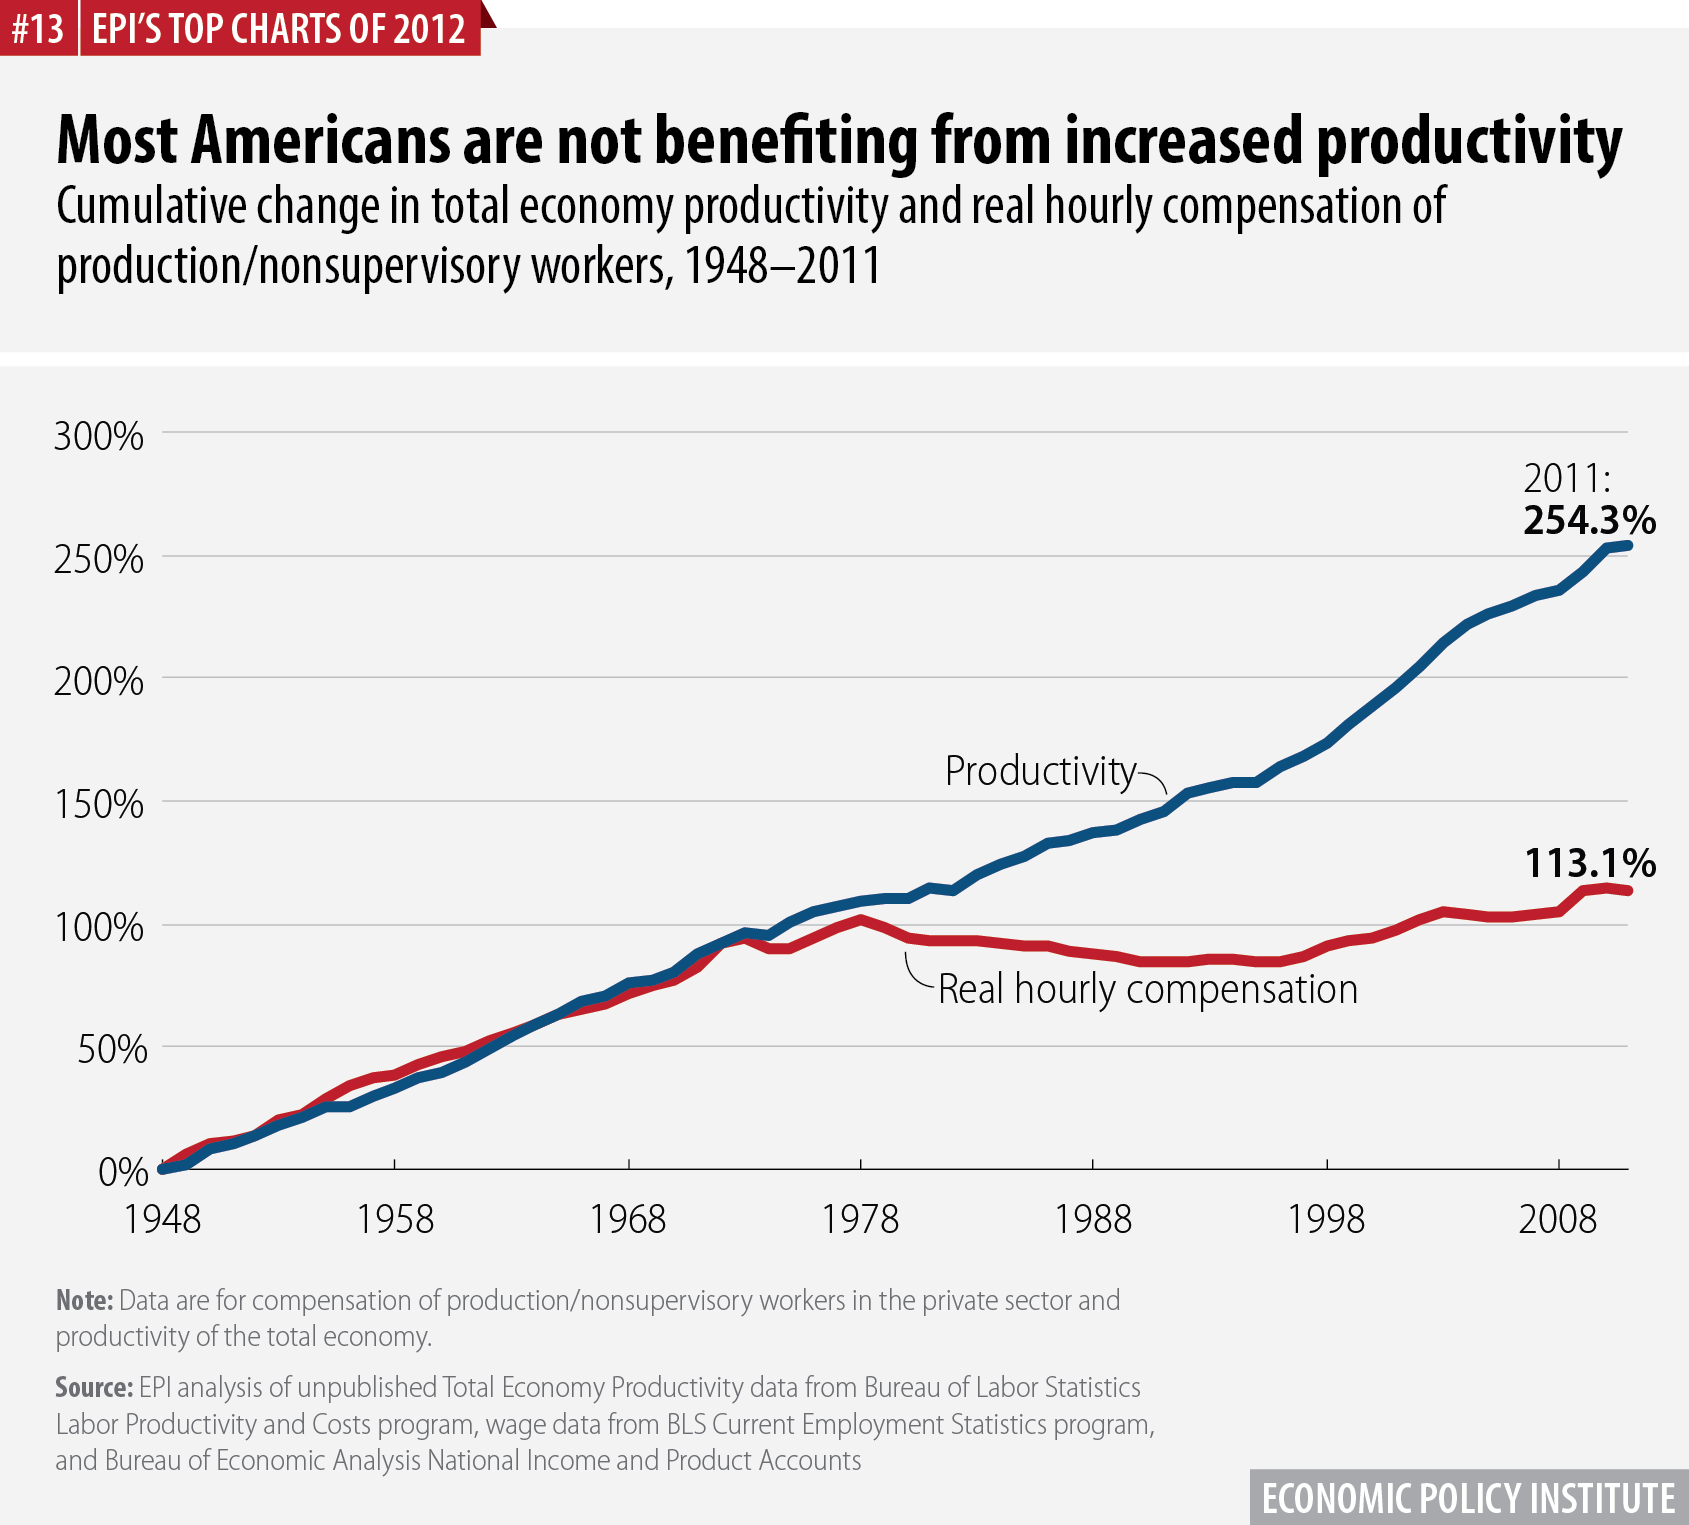
Productivity in the overall economy and the typical worker’s hourly compensation grew together from 1948 until 1973. After 1973, however, productivity continued to grow strongly, especially after 1995, while the typical worker’s compensation was relatively stagnant. This divergence of pay and productivity has meant that many workers have not benefited from productivity growth; the economy could afford higher pay but was not providing it. This is perhaps the most important fact of economic life for most American families in recent decades.
Adapted from The State of Working America, 12th Edition, Figure 4U
