The Bureau of Economic Analysis (BEA) released data today on growth in gross domestic product (GDP)—the broadest measure of the nation’s economic activity—for the second quarter of 2013. While much attention will focus on the extensive revisions the BEA made to its methodology for calculating GDP, one shouldn’t miss the essential message of today’s data: The U.S. economy continues to grow far too slowly to work off the excess slack in labor, product, and capital markets that developed over the Great Recession. Over the past year, the U.S. economy has grown 1.4 percent, a rate far too slow to reliably lower the unemployment rate going forward if this performance is repeated in the next year.
Overall GDP grew at a 1.7 percent annualized rate in the second quarter, following growth of 1.1 percent in the previous quarter. Final sales (GDP minus the influence of inventory investment, which is both volatile quarter-to-quarter and yet trivial over any longer time span) grew even more slowly, at 1.3 percent in the second quarter.
Personal consumption expenditures contributed 1.2 percentage points to the quarter’s growth rate, and fixed investment contributed another 0.9 percentage points. Residential investment continued its strong growth—adding 0.4 percentage points to the overall growth rate. The rebound in housing is perhaps the single brightest spot in the U.S. economy at the moment. Business investment in both equipment and software and structures turned in stronger-than-average performance as well. Inventory investment added 0.4 percentage points to the quarter’s overall growth rate.
Negative contributions to growth were made by net exports (-0.8 percentage points) and government spending (-0.1 percentage points). Exports grew in the quarter, but imports grew faster (and from a larger base), so on net, trade flows made their largest negative contribution to growth since the second half of 2010. Federal spending subtracted 0.1 percentage points off of the quarter’s growth rate, while state and local government spending was essentially flat (adding 0.04 percentage points in the quarter). It is unfortunate that just as the substantial drags imposed since the Great Recession began by residential investment and state and local government spending are either reversing (residential investment) or moderating (state and local government spending), austerity at the federal level has made this sector a significant drag on growth.
A key sign that the economic weakness documented in today’s report is the result of deficient demand throughout the economy can be seen in the “market-based” price index for personal consumption expenditures, excluding food and energy costs (this is a closely watched measure of “core” inflation). Over the past year, it grew 1.1 percent, well below even too-conservative targets of 2 percent annual growth that are often mentioned as benchmarks for macroeconomic policymaking. And this growth was the slowest since the first quarter of 2011. This measure has not exceeded 2.0 percent since the third quarter of 2008.
The personal savings rate rose sharply in the second quarter of 2013 after falling sharply in the first quarter. This pattern is consistent with households adjusting their consumption spending with a lag after the expiration of the 2 percent payroll tax cut that was in effect for 2011 and 2012 to stimulate the economy. The impact of this expiration was hard to see in the first-quarter data, but the slowdown in consumption spending and the rise in the personal savings rate in the second quarter indicates that it is having the effect many feared (i.e., slowing private-sector demand growth).
Methodological revisions
Much attention about today’s data release will focus on BEA’s new methodology for calculating GDP. This new methodology generally makes two large changes. First, it reclassifies some spending made by businesses as long-lived investment rather than current intermediate costs. This means that this reclassified spending now boosts measured GDP (which excludes intermediates costs, but does include investments). Most of this newly reclassified spending concerns spending to create intellectual property. Second, it modifies how employers’ spending on pension plans is reflected in GDP accounts, by changing to accrual accounting from cash-based accounting.
These changes have been debated, discussed, and previewed for years. The BEA is a highly professional and competent agency that has a well-deserved reputation for treating all issues regarding data with integrity. These methodological changes are theoretically clear improvements in how GDP is expressed. However, actually implementing the first change (classifying some business spending on creating intellectual property as long-lived investment) could well be a daunting challenge with numerous pitfalls, even for the most competent and honest number-crunchers. Disentangling business spending that creates intellectual property that improves the ability to provide more (or better) consumer goods and services in the future from business spending that simply creates intellectual property by securing the right to charge monopoly prices (without improving the ability to create more or better consumer goods and services in the future) can be extraordinarily hard.
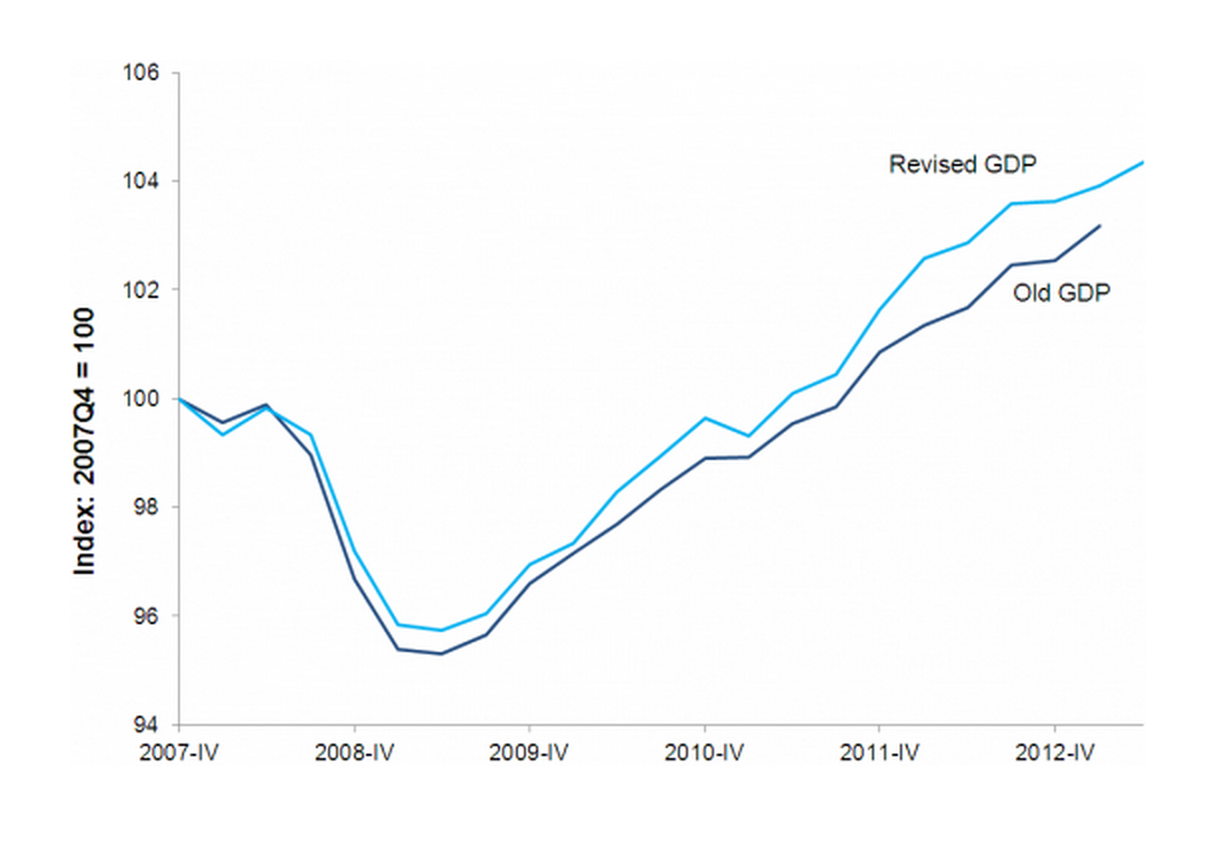
It should also be noted that on the most pressing macroeconomic issue of today—how far the U.S. economy is from full health—the revisions introduced today slightly change our assessment, at least on first glance. Figure A shows the path of GDP contraction, recovery, and expansion over the Great Recession and subsequent recovery. It shows this path with the previous GDP data series as well as the newly revised series. While the Great Recession remains an extraordinarily deep and lengthy contraction, the revised data series show it as slightly shallower and recovery slightly faster than the previous series.
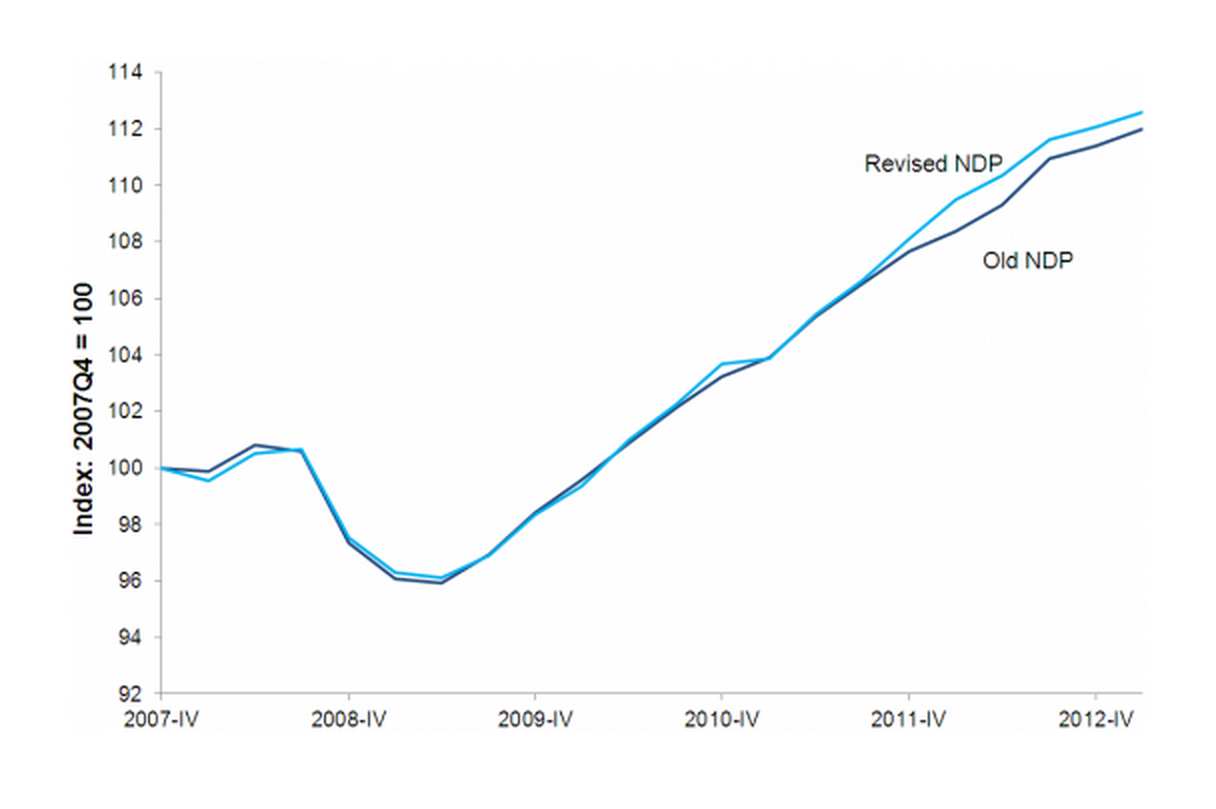
However, because the revisions classify more spending in the economy as investment in long-lived capital, this means they also raise the estimate of the nation’s total capital stock. This, in turn, raises the amount of depreciation experienced each quarter in the economy. Gross domestic product does not account for depreciation of the capital stock (hence the “gross” in its title). Measures of net domestic product (which do account for larger depreciation costs post-revision), depicted in Figure B, show a much tighter correlation between old and new measures over the latest business cycle—the recessions are equally deep, though recovery remains slightly faster (though trivially, relative to the total gap between actual and potential output) in the revised series. This hammers home the need, post-revision, to pay closer attention to net, not just gross, measures of economic output.
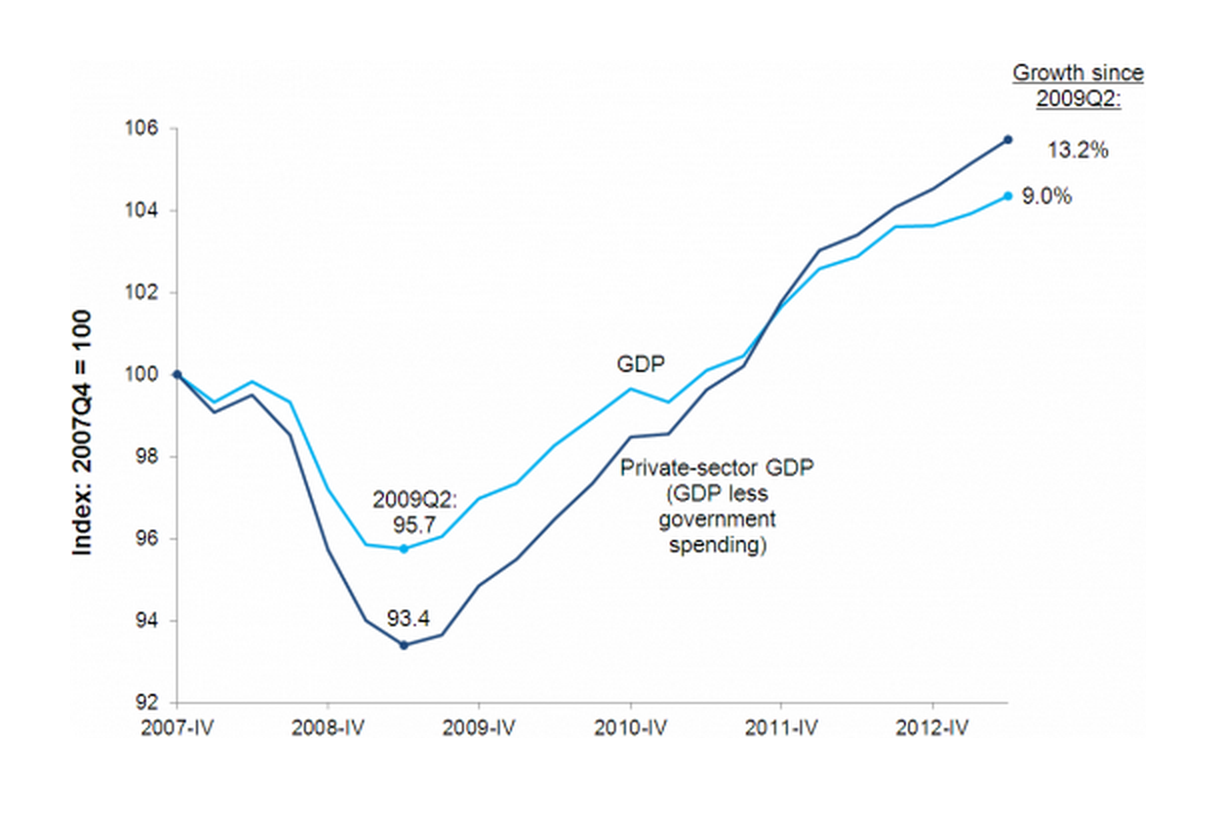
Further, the most obvious cause of economic weakness since the official recovery from the Great Recession began is similarly unchanged by the revised data: Austerity, both at the state and local levels and now at the federal level, has imposed a severe drag on recovery. Figure C charts overall GDP and private-sector GDP (GDP minus government consumption expenditures and investments) over the recession and recovery. Since the official recovery began in the middle of 2009, private-sector GDP has risen by 13.2 percent cumulatively, while overall GDP has risen by only 9.0 percent. Had overall GDP not been dragged down by austerity and risen at just the same rate as private-sector GDP, the U.S. economy would have roughly 4 million more people working today, and nearly half of the economy’s jobs gap would be gone. It also should be noted that this is a substantial understatement of the effect of austerity, as it only measures government cutbacks that run through direct government spending. Cutbacks of transfer payments (i.e., reduced unemployment insurance benefits) and tax increases (the expiration of the temporary payroll tax cut) both slow private-sector GDP as well.
The most important message, by far, in today’s data about GDP is simply that the U.S. economy continues to grow far too slowly to reliably pull down today’s too-high unemployment rate and generate enough jobs for willing workers. The revisions are interesting for many reasons, but they absolutely do not change this basic story.
