Income Picture for September 10, 2009
Note: For an analysis of health insurance coverage, see today’s Health Picture
Listen to a press call on this topic featuring Lawrence Katz, Lawrence Mishel, Heidi Shierholz, and Elise Gould
[listen/stream] [download MP3] (35 min.)
This morning’s report by the U.S. Census Bureau shows that the real (inflation-adjusted) income of the median household fell 3.6%, from $52,163 in 2007 to $50,303 in 2008. The poverty rate increased from 12.5% in 2007 to 13.2% in 2008.
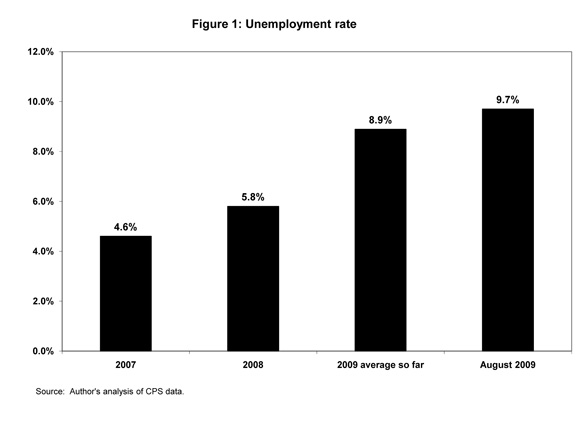
While the 3.6% decline in median income in 2008 was the largest one-year decline on record (since 1967) and the increase in poverty was the largest one-year increase in poverty since 1991, an important thing to keep in mind about today’s data release is that it captures only a small portion of the deterioration in the economy up to this point in the recession. To illustrate this point, Figure 1 shows the unemployment rate for 2007, 2008, the average in 2009, and the latest data available (August 2009). The unemployment rate increased by 5.1 percentage points over this period — from 4.6% in 2007 to 9.7% in August 2009 — so the increase of 1.2 percentage points from 2007 to 2008 captures less than a quarter of the total rise in unemployment over the downturn so far, and the labor market is still deteriorating. In other words, the decrease in income and increase in poverty from 2007 to 2008 are just the tip of the iceberg when it comes to the effects of this recession on the living standards of Americans.
Key findings from today’s report
Income
• Real median income declined by $1,860, from $52,163 in 2007 to $50,303 in 2008, a decline of 3.6%, the largest one-year drop on record (i.e., since 1967).
• All racial and ethnic groups saw large declines in income in 2008, with Hispanics getting hit particularly hard. The median white non-Hispanic income declined by 2.6% from 2007 to 2008, while African American households experienced a decline of 2.8%. The median Hispanic household income declined by 5.6% from 2007 to 2008, and the typical Asian household income declined by 4.4%. The large decline in Hispanic income in 2008 is likely related to that group’s concentration in the construction industry, which has been particularly hard hit this recession due to the bursting of the housing bubble.
• The 2008 data show that inequality, which has been on the rise since the early 1970s, did not increase in 2008 as the recession hit people all across the income distribution. In 2008, workers at the 20th percentile saw a decline in income of 1.7%, while workers at the 95th percentile saw a decline of 2.1%.
• Projections: From 2007 to 2008, the average income for the typical household declined by $1,756. We project that it will likely decline by an additional $2,456 in 2009, and by an additional $601 in 2010, for a total decline of $4,813 from 2007 to 2010. This is a decline in income of 9.3% for the typical household over these three years.
Poverty
The poverty rate increased from 12.5% to 13.2% between 2007 and 2008, representing an additional 2.6 million people living in poverty. The large increase in poverty suggests that as anti-poverty policies have come to depend more on paid work as the main pathway out of poverty, the safety net has become less effective in reducing economic hardship when the economy and job market are underperforming.
• The poverty rate for children was 19.0% in 2008, representing 14.1 million kids living in poverty. In 2008, over one-third (35.3%) of all people living in poverty were children.
• It is important to note that the federal poverty threshold as currently measured is widely understood by poverty researchers to be an inadequate measure of the income needed to make ends meet. Poverty experts often use twice the poverty line as a more accurate threshold for material deprivation. In 2008, 31.9% (96 million people) were living below twice the poverty threshold, up from 30.5% in 2007. The number was even higher for children, with 40.6% of children (30.1 million) living below “twice poverty,” up from 39.2% in 2007.
• Hispanics and Asians were particularly hard-hit by increases in poverty in 2008, increasing by 1.6 and 1.4 percentage points, respectively, from 2007 to 2008.
• In 2008, over one-third (33.9%) of all black children and nearly one-third (30.6%) of all Hispanic children were living in poverty (increases of 0.2 and 2.0 percentage points, respectively, since 2007).
• In 2008, 37.2% of all families headed by single mothers were living in poverty (up 0.2 percentage points from 2007). In 2008, of the 8.1 million families living in poverty, 3.6 million of them were headed by a single mom.
• Projections: We project that the overall poverty rate will likely increase by 1.5 percentage points in 2009 and by an additional 0.4 percentage points in 2010, for a total increase of 2.6 percentage points from 2007 to 2010. For children, the poverty rate will likely increase 8.6 percentage points from 2007 to 2010, to 26.6% in 2010. For blacks, the poverty rate will likely increase by 7.3 percentage points from 2007 to 2010. By 2010, we project that nearly one-third (31.8%) of all African Americans living in the United States will be living in poverty. For single-mother families, the number will likely be even higher, at 46.4%.
Largest income decline on record
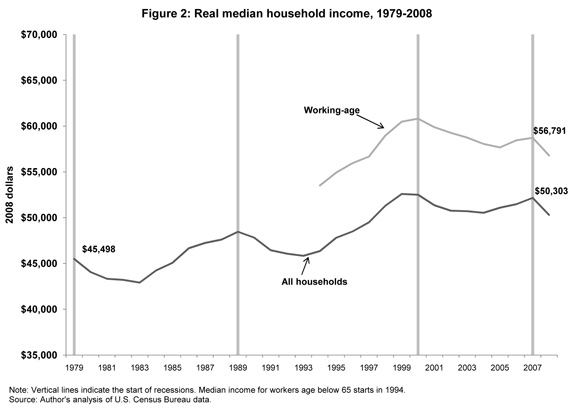
Real median income declined by $1,860 from 2007 to 2008, a decline of 3.6%, the largest one-year decline on record (since 1967). The real median income of working-age households (under 65 years old) declined at about the same rate, falling by $1,927 from $58,718 to $56,791. Figure 2 shows real median income over the last 30 years both for all households and, starting in 1994 when the data became available, for working-age households. A key point here is the comparison between business cycles. From 1979 to 1989, real median income grew $2,965, (from $45,498 to $48,463,) and from 1989 to 2000, it grew $4,037, (from $48,463 to $52,500). But for the first time on record, over the business cycle from 2000-2007, incomes didn’t rise — they fell slightly from $52,500 to $52,163. And with the weak labor market over this period, the real median income of working-age households fell significantly, from $60,804 to $58,718. This means that working families are weathering the current economic recession without the cushion that a robust expansion prior to the recession would have afforded them.
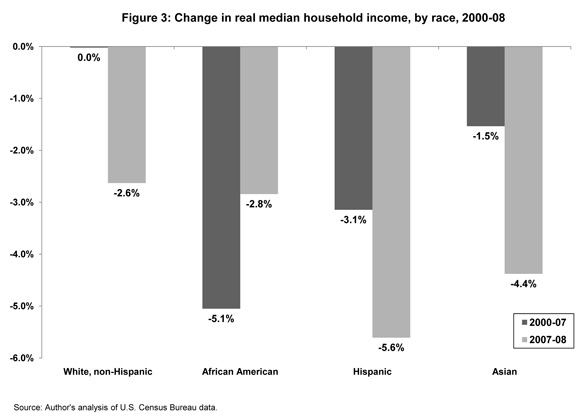
All racial and ethnic groups saw large declines in income in 2008, with Hispanics getting hit particularly hard. Figure 3 shows the percentage change in real median incomes for various racial and ethnic groups from 2000 to2007 and from 2007 to 2008. The median white, non-Hispanic income declined by 2.6% from 2007 to 2008, while African American household experienced a decline of 2.8%. The median Hispanic household declined by 5.6% from 2007 to 2008 and the typical Asian household declined by 4.4%. The large decline in Hispanic income in 2008 is likely related to Hispanic concentration in the construction industry, which has been particularly hard hit this recession due to the bursting of the housing bubble.
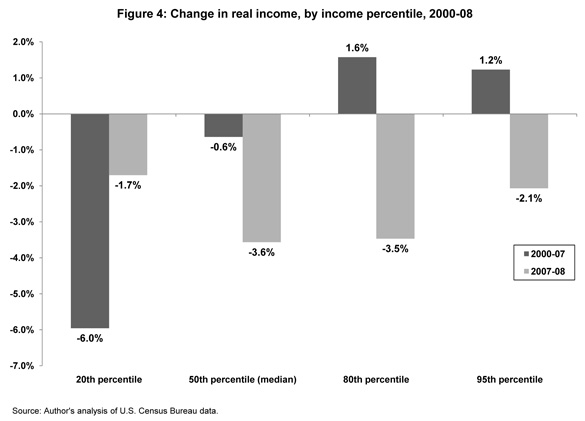
< p>The 2008 data show that inequality, which has been on the rise since the early 1970s, did not increase in 2008, as the recession hit people all across the income distribution (though not equally). Figure 4 plots the percent change in real household income at various points along the income scale, from the 20th percentile (the point at which 20% of households have lower and 80% have higher income) to the 95th percentile (where only 5% have higher income). From 2000 to 2007, workers at the 20th percentile saw a 6.0% decline in income, followed in 2008 by a further decline of 1.7%. Workers at the 95th percentile saw an increase of 1.2 percent from 2000 to 2007, but a decrease of 2.1% in 2008.
Today’s report also provides breakdowns in earnings by gender for full-time, full-year workers. Women who work full-time, full-year are feeling the effects of this recession somewhat more than men with respect to earnings. After increasing by 6.2% from 2000 to 2007, the earnings of full-time, full-year female workers declined by 1.9% in 2008, from $36,451 to $35,745. Men working full-time, full-year saw an increase of only 0.6% from 2000 to 2007, and in 2008 experienced a decline of 1.0%, from $46,846 to $46,367.
However, what is particularly astonishing is the 4.6 million decline in the number of earners working full-time (35 hours or more) and full-year (at least fifty weeks). Most of this decline was among men — 3.1 million fewer men worked both full-time and full-year in 2008 compared to 2007. This erosion in full-time, full-year workers was equally due to a loss of full-time work (shifting to part-time) and an erosion of weeks worked. The consequence of both of these trends — lower real earnings and eroded work-time — was a record decline in the annual inflation-adjusted earnings of the median worker — a loss of 4.0%.
Poverty: Gains from 1990s now lost
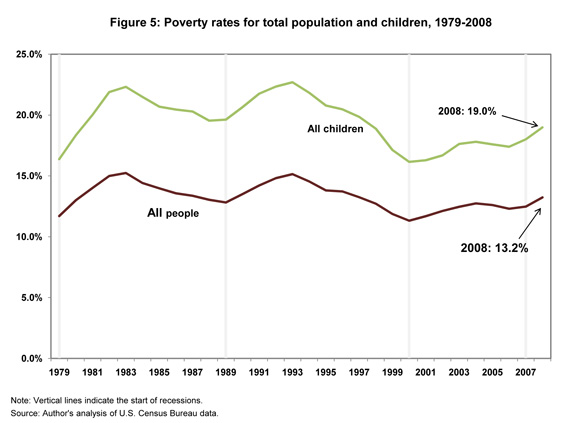
Between 2007 and 2008, an additional 2.6 million people slipped below the poverty line, as the poverty rate increased from 12.5% to 13.2% between 2007 and 2008. Poverty is now at a higher rate than the country faced four decades ago, in 1968. The poverty rate for children, at 19.0% in 2008, was higher than the overall rate and increased more (by 1.0 percentage points) from 2007. The 2008 rate represents 14.1 million kids living in poverty. In 2008, 35.3% of all people living in poverty were children.
Figure 5 shows the poverty rate over the last 30 years, both overall and for children. Much of the decline in poverty achieved during the business cycle of the 1990s has now been reversed. Overall poverty declined by 1.5 percentage points, and child poverty dropped by 3.5 percentage points from 1989 to 2000. From 2000 to 2008, however, poverty increased overall by 1.9 percentage points, and by 2.8 percentage points among children. The large increase in poverty suggests that as anti-poverty policies have come to depend more on paid work as the main pathway out of poverty, the safety net has become less effective in reducing economic hardship when the economy and job market are underperforming.
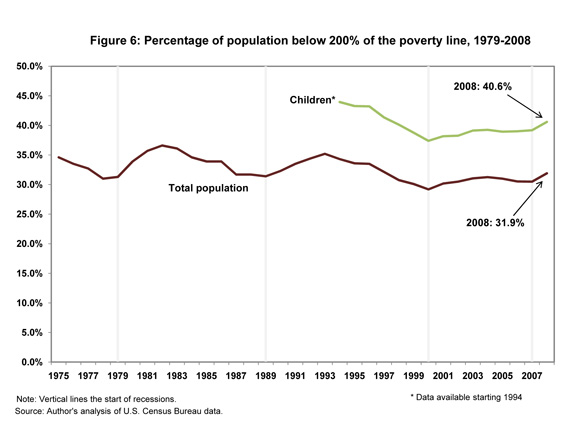
Furthermore, it is important to note that the federal poverty threshold as currently measured is widely understood by poverty researchers to be a vastly outdated and inadequate measure of the income needed to make ends meet. Poverty experts often use twice the poverty line as a more accurate threshold for material deprivation. Figure 6 shows the percent of people living below twice the poverty threshold (as an example, for a family of three with one adult and two children, the official poverty threshold in 2008 was $17,346, so twice their poverty threshold would be $34,692). In 2008, 31.9% —96 million people — were living below the twice-poverty threshold. This was up from 30.5% in 2007. The number was even higher for children, with 40.6% of children — 30.1 million kids — living below the twice-poverty line, up from 39.2% in 2007.
As with income, poverty changes have varied across racial and ethnic groups, with Hispanics and Asians being particularly hard-hit by increases in poverty in 2008. Figure 7 shows percentage-point changes in the poverty rate for various racial and ethnic groups in the 2000-07 and 2007-08 periods. African Americans in particular have seen big increases in poverty this decade; after attaining the lowest poverty rate on record in 2000 (22.5%), black poverty increased by 1.9 percentage points from 2000 to 2007, but only by 0.2 percentage points in 2008. Hispanic and Asian poverty rates increased by 1.6 and 1.4 percentage points, respectively, from 2007 to 2008. As with the income declines outlined above, the large increase in Hispanic poverty in 2008 compared to earlier this decade is likely related to Hispanic concentration in the construction industry, which has been particularly hard hit this recession due to the bursting of the housing bubble.
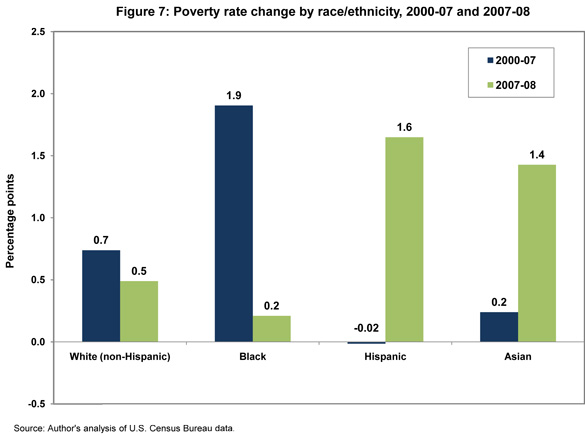
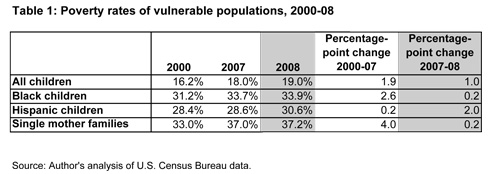
Table 1 shows changes over time in poverty rates for particularly vulnerable populations — children, racial and ethnic minority children, and single mother families. From 2000 to 2007, black children experienced a 2.6 percentage-point increase in poverty to 33.7%, and in 2008, a further increase to 33.9%. Hispanic children experienced an increase of 2.0 percentage points in 2008. For the families of single mothers, there was a 4.0 percentage point jump from 2000 to 2007 to 37.0%, and a further increase in 2008 to 37.2%. In 2008, of the 8.1 million families living in poverty, 3.6 million of them were headed by single moms.
Many of those living in poverty are children, elderly, or are otherwise not working. Today’s report provides data on the poverty rates of workers (specifically, people who worked at least one week in 2008) — an important group to look at since this group will be particularly sensitive to the increasing weakness in the labor market. Workers experienced an increase in poverty from 5.7% in 2007 to 6.4% in 2008, after increasing by only 0.1 percentage points from 2000 to 2007. Looking specifically at full-time, year-round workers, their poverty rate jumped from 2.5% in 2007 to 2.6% in 2008, after an increase of 0.1 percentage points from 2000 to 2007.
What can we expect for 2009 and 2010?
As mentioned above, the declines in income and increases in poverty in 2008 capture only a fraction of what will be the ultimate effect of the current recession. Based on unemployment projections for the rest of 2009 and 2010, along with the dynamic between unemployment,, income, and poverty, we project in Table 2 the changes in income and poverty for 2009 and 2010.1
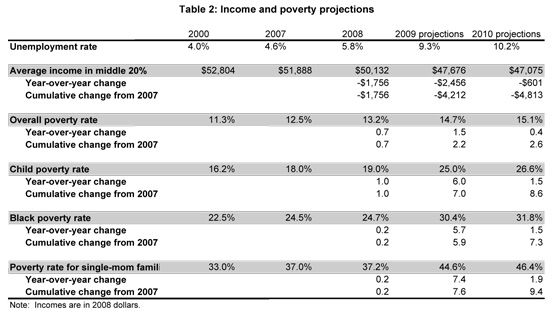
We find that the average income for the middle 20% of households will likely decline by $2,456 in 2009, and by an additional $601 in 2010, for a total decline of $4,813 from 2007 to 2010. This is a decline in income of 9.3% for the typical household over these three years. Given the decline in income over the weak business cycle from 2000 to 2007, this means that after reaching an all-time peak in 2000, by 2010 real incomes for the typical household will likely have declined by $5,729, or 10.8% — truly a lost decade.
Furthermore, we find that the overall poverty rate will likely increase by 1.5 percentage points in 2009 and by an
additional 0.4 percentage points in 2010, for a total increase of 2.6 percentage points from 2007 to 2010. Given the increase in poverty from 11.3% to 12.5% from 2000 to 2007, this means poverty rates will have increased by around 3.8 percentage points from 2000 to 2010. For children, the poverty rate will likely increase by 8.6 percentage points in the 2007-10 period, for a total increase of 10.4 percentage points from 2000 to 2010. For blacks, the poverty rate will likely increase by 7.3 percentage points from 2007 to 2010, for a total increase of 9.3 percentage points from 2000 to 2010. By 2010, we project that nearly one-third (31.8%) of all African Americans living in the United States will be living in poverty. For single-mother families, the number will likely be even higher, at 46.4%.
Today’s report shows that the household income and anti-poverty gains made in the 1990s have come to a halt, and that the effects of the current recession, along with the weak business cycle from 2000 to 2007, mean that both typical households and the poorest Americans are now facing substantial declines in living standards.
—Research assistance provided by Andrew Green and Anna Turner.
Note
1. Elasticities for changes in income given changes in unemployment are taken from Table 5.2 in Bartik, Timothy, Jobs for the Poor: Can Labor Demand Policies Help?, New York: Russell Sage Press, 2001. Elasticities for changes in poverty given changes in unemployment are taken from Table 4 in Blank, Rebecca, “Economic Change and the Structure of Opportunity for Less-Skilled Workers” in Changing Poverty, Changing Policies, Maria Cancian and Sheldon H. Danziger, eds. New York: Russell Sage Press, 2009.
To view archived editions of INCOME PICTURE, click here.
The Economic Policy Institute INCOME PICTURE is published upon the annual release of family income data from the Census Bureau. EPI offers same-day analysis of income, employment, and other economic data released by U.S. government agencies.
