Briefing Paper #370
In recent years, Native Americans have increased their income and wealth through new and innovative economic development activities. For instance, tribes have increased their control over their natural resources and food systems, they have become players in the country’s energy sector, and they have begun trading with Asia (National Congress of American Indians 2013b). Despite these positive developments, however, Native Americans are still one of the United States’ most economically disadvantaged populations.
In 2011, about one in four American Indians and Alaska Natives1 (26.4 percent) lived in poverty. In contrast, about one in 10 non-Hispanic whites (11 percent) lived in poverty (U.S. Census Bureau 2013). Not surprisingly, the Native American population is a relatively low-wealth population. In 2000, Native Americans’ median wealth was equal to only 8.7 percent of the median wealth among all Americans (Chang 2010, 14). For most Americans, a home is a key source of wealth. Native Americans, however, have a significantly lower homeownership rate than whites, and the homes they do own tend to be worth much less than those of whites (Insight Center for Community Economic Development 2009, 1).
As has long been the case, many Native American communities are economically depressed, and their jobless rates are high. Only when Native Americans have a high and steady employment rate will their poverty rate decline and their wealth begin to grow.
This briefing paper examines the problem of the low rate of American Indian employment and outlines strategies to address it. Part I examines American Indian employment rates, the Native American–white employment rate gap nationally and by state, and possible causes of this gap. There is also some exploratory analysis of employment rates by tribe. Part II consists of policy recommendations for increasing American Indian employment.
Part I finds:
- Over 2009–2011, the American Indian employment rate among 25- to 54-year-olds (i.e., the share of that population with a job) was 64.7 percent—13.4 percentage points lower than the white rate.
- Of the 34 states examined for Native American employment over 2009–2011, the highest American Indian employment rates were in Nebraska (73.4 percent), Connecticut (72.0 percent), and Texas (71.3 percent).
- In all of the 34 states examined, there was a large, very large, or extremely large Native American–white employment rate disparity in 2009–2011. The largest disparities were in the Midwest among the states with some of the highest white employment rates.
- Even when Native Americans are similar to whites in terms of factors such as age, sex, education level, marital status, and state of residence, their odds of being employed are 31 percent lower than those of whites.
- High educational attainment is the factor most likely to increase American Indians’ odds of securing employment.
Part II presents a variety of proposals to improve Native American employment outcomes. It argues:
- All levels of government should support strong Native American self-determination and leadership.
- The number of Native American community development financial institutions should be increased, and existing ones should be strengthened.
- Researchers need to conduct investigations of the states and tribes with the best Native American employment situations to see what lessons can be learned.
- Researchers need to conduct investigations of the states with the worst Native American employment situations to see what can be improved.
- The following policies will likely increase the Native American employment rate through improved educational outcomes:
- Improving Native American maternal and child health
- Providing high-quality early childhood education for Native American children
- Maximizing the number of regular high school diplomas obtained by Native Americans
- Increasing the number and size of tribal programs supporting higher education
- Researchers should investigate the role of racial discrimination in Native American employment outcomes.
- To better understand tribal labor market conditions, researchers will need better labor market data than are available in the American Community Survey.
Part I: An examination of the Native American employment rate
The following sections explain that despite making some strides in recovering from a long history of subjugation, American Indians still suffer economically. In particular, they have employment rates far below those of whites, both in the country overall and at the state level. Additionally, Native Americans have lower odds of employment than whites even after accounting for various demographic factors.
The “painful legacy of discrimination”
Native America continues to struggle to recover from a long history of subjugation. As President Obama recently remarked, “The painful legacy of discrimination means that . . . Native Americans are far more likely to suffer from a lack of opportunity—higher unemployment, [and] higher poverty rates” (White House Office of the Press Secretary 2013). The good news is that Native Americans are recovering politically, economically, and culturally. The bad news is that there is still a long way to go.
The land that is the United States, of course, once all belonged to indigenous peoples. This land, and its resources and assets, were taken by European immigrants through conquest, expropriation, theft, and broken treaties. In addition to this tremendous loss of wealth, Native Americans also lost political autonomy. Political and economic subjugation would, in and of itself, produce tremendous cultural damage, but Native Americans were also repeatedly subject to forced cultural assimilation.
However, as the former president of the National Congress of American Indians, Jefferson Keel (2013), recently observed, Native America is now in an era of recovery. “My tribe, the Chickasaw Nation,” he reported, “contributes $2.5 billion to our regional economy every year and employs over 12,000 people.” He also noted that the Moapa Band of Paiute Indian Nation is building the largest solar power plant on tribal lands; the plant is contracted to provide power to over 100,000 Los Angeles homes. Furthermore, the Tlingit and Haida tribes are among the top employers in southeast Alaska. As a result of developments like these, “more highly-skilled and educated Native young people are coming back to serve in our communities as doctors, lawyers, teachers, engineers, entrepreneurs” (Keel 2013).
While there is much evidence of Native Americans using initiative, creativity, and their cultural traditions to improve their economic conditions, there is still much work to be done. Tribes need the federal government to fully honor its promised obligations (see National Congress of American Indians 2013a). Native Americans also need the federal government to focus on the country’s economic future by addressing the jobs deficit and by making investments in health, education, and infrastructure. Without these investments, the challenges for American Indians will be significantly greater.
Why focus on the employment rate
One major factor behind the high poverty rates and low wealth of American Indians is their low rate of employment. The Native American unemployment rate is considerably higher than the white rate (Austin 2013). Without work, it is difficult for an individual to rise out of poverty; without a well-paying job, it is difficult to save, purchase a home, and build wealth. Thus, increasing Native American employment is necessary for addressing Native American poverty, and is a foundational step toward building Native American wealth.
While the unemployment rate is the most commonly used measure of joblessness, it is not the best measure for populations suffering from chronically high unemployment. In these communities a significant segment of the population stops looking for work because their odds of finding work are very low. Once someone stops looking for work, she is no longer counted as unemployed; she is defined as not being in the labor force. Technically, to be “unemployed,” one has to be actively looking for work.
The employment rate, or the employment-to-population ratio, is a better measure for populations suffering from chronically high unemployment. This measure simply provides the share of the population that is working. Whether or not individuals are actively looking for work does not affect the measure.
Native American and white employment rates
The analysis below compares the employment rates (i.e., the employment-to-population ratios) of whites and American Indians in their prime working ages (between 25 and 54 years old), when their employment rates should be highest. It uses data from the 2009–2011 American Community Survey (ACS). This survey provides a large enough sample of American Indians for detailed analyses.2
Table 1 presents the employment and unemployment rates of 25- to 54-year-old American Indians and whites nationally. For the 2009 to 2011 period, the American Indian employment rate was 64.7 percent, 13.4 percentage points lower than the white rate. This is a very large disparity. For all 25- to 54-year-olds, the Great Recession resulted in a 3.1 percentage-point decline in the employment rate from 2007 to 2010.3 The 2009–2011 American Indian–white employment rate gap is more than four times the size of the decline seen nationally over the Great Recession. Thus, the data suggest that, relative to whites, Native Americans typically live under economic conditions comparable to a recession with impacts four times as harmful as the Great Recession’s overall effects.
American Indian and white employment and unemployment rates, ages 25–54, 2009–2011
| American Indian | White | Difference (American Indian – white) | Number of jobs needed to make the American Indian rate equal the white rate | |
|---|---|---|---|---|
| Employment rate | 64.7% | 78.1% | -13.4 | 233,901 |
| Unemployment rate | 14.6% | 7.7% | 6.9 | 90,977 |
Note: These weighted data include American Indian multiracials and Hispanics of both races, but exclude the foreign born.
Source: Author's analysis of American Community Survey data from Ruggles et al. (2013)
Table 1 also shows the American Indian–white unemployment rate gap. The American Indian unemployment rate averaged 14.6 percent over 2009–2011, 6.9 percentage points higher than the white rate of 7.7 percent. Not only is the size of the disparity larger using the employment rate (13.4 percentage points versus 6.9 percentage points), but the denominator is also larger. The employment rate’s denominator is the entire working-age population, whereas the unemployment rate’s denominator is the labor force (only the people who are employed or actively looking for work). Any other jobless individuals are not in the labor force.
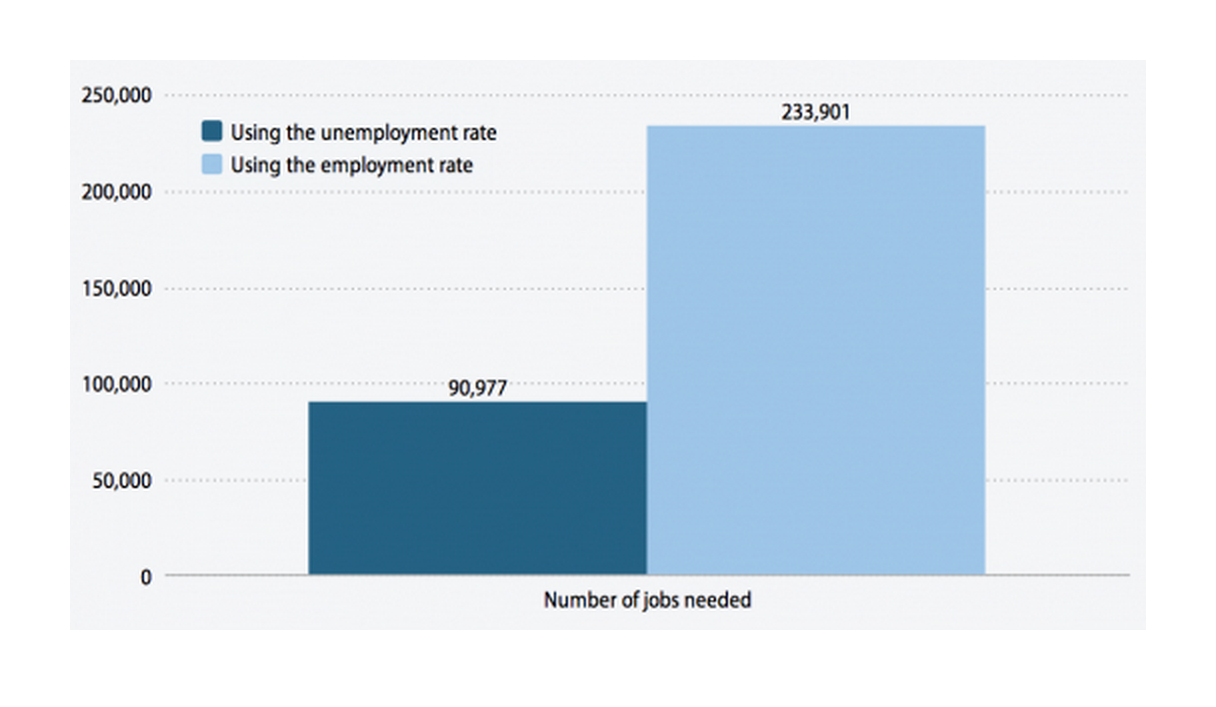
Figure A illustrates the value of focusing on the employment rate over the unemployment rate. To reduce the Native American unemployment rate among the 25- to 54-year-old population to the white rate would require about 91,000 jobs. To increase the Native American employment rate to the white rate would require more than twice as many jobs—about 234,000. This larger number is a better measure of the economic hardship among American Indians.
Number of jobs needed to make the American Indian rate equal the white rate among the 25- to 54-year-old population, 2009–2011
| Using the unemployment rate | Using the employment rate | |
|---|---|---|
| Number of jobs needed | 90,977 | 233,901 |
Note: These weighted data include American Indian multiracials and Hispanics of both races, but exclude the foreign born.
Source: Author's analysis of American Community Survey data from Ruggles et al. (2013)
A large share of the Native American population identifies as multiracial. One may be interested to know whether this difference in identification matters for individuals’ ability to find employment. Table 2 shows that among the prime-working-age population, there does appear to be a difference between the population that identifies as American Indian alone and the population that identifies as American Indian or Alaska Native in combination with some other racial group(s). The “American Indian alone” population has an employment rate 3.2 percentage points lower than the “in-combination” population. While this is a statistically significant and substantive difference, it is dwarfed by the Native American–white difference for either group. The “alone” versus “in-combination” difference is appropriate for further study, but it will not be examined further in this report. The analyses in this report will combine the data from the “alone” and the “in-combination” American Indian and Alaska Native populations.
Employment rates of single-race and multi-racial American Indians, ages 25–54, 2009–2011
| American Indian alone | American Indian in combination with other races | Difference (alone – in combination) |
|---|---|---|
| 63.2% | 66.4% | -3.2 |
Note: These weighted data include American Indian multiracials and Hispanic American Indians, but exclude the foreign born.
Source: Author's analysis of American Community Survey data from Ruggles et al. (2013)
Men and women can experience very different labor markets. Women are still the primary caregivers for children and the elderly; they thus may have lower rates of participation in the paid labor force. Table 3 shows that while both 25- to 54-year-old American Indian men and women are less likely to be employed than their white peers, the Native American–white gap for males is larger than the gap for females. Also, while men generally have a higher employment rate than women, the gender gap among American Indians is smaller than the gap among whites. An exploration of gender differences is worthy of further study, but it will not receive a detailed examination in this report.
Employment rates of American Indians and whites, ages 25–54, by gender, 2009–2011
| American Indian | White | Difference (American Indian – white) | |
|---|---|---|---|
| Male | 68.0% | 83.2% | -15.2 |
| Female | 61.8% | 73.2% | -11.3 |
| Difference (male – female) | 6.2 | 10.0 |
Note: These weighted data include American Indian multiracials and Hispanics of both races, but exclude the foreign born.
Source: Author's analysis of American Community Survey data from Ruggles et al. (2013)
It is reasonable to wonder to what extent Native Americans’ employment problems are due to their residence on reservations and tribal lands. Table 4 presents the employment rates of prime-working-age American Indians living on or close to reservations and of those not living on or close to reservations. While the employment rate of American Indians on reservations is lower than that of those off reservations, both rates are low and only 2.5 percentage points apart. In short, the problem of low Native American employment is not limited to the on-reservation population.
Employment rates of American Indians living on and off reservation,* ages 25–54, 2009–2011
| On reservation | Off reservation | Difference (on reservation – off reservation) |
|---|---|---|
| 63.4% | 65.9% | -2.5 |
* On reservation = living on or close to reservations or tribal lands
Note: These weighted data include American Indian multiracials and Hispanic American Indians, but exclude the foreign born.
Source: Author's analysis of American Community Survey data from Ruggles et al. (2013)
State employment rates
The American Community Survey has a sufficient sample size to permit an examination of Native American employment rates by state. We will focus on the 33 states that contain Native American reservations and tribal lands, plus Illinois (because many Native Americans were relocated to Chicago during the Urban Indian Relocation Program of the mid-20th century).4 Therefore, we will highlight data from 34 states.
Table 5 displays employment rates for these 34 states among prime-working-age (i.e., 25- to 54-year-old) American Indians and whites. It shows that the highest American Indian employment rates were spread across the country. Nebraska (73.4 percent), Connecticut (72.0 percent), and Texas (71.3 percent) were the top three states of the 34 examined for Native American employment in 2009–2011. The lowest Native American employment rates were in South Dakota (54.8 percent), Arizona (56.6 percent), and Utah (57.3 percent).
White and American Indian employment rates of 25- to 54-year-olds for states with tribal lands,* 2009–2011
| Native American rank | White rank | Native American–white disparity rank |
State | American Indian | White | Difference (American Indian – white) |
|---|---|---|---|---|---|---|
| 1 | 3 | 22 | Nebraska | 73.4% | 85.6% | -12.3 |
| 2 | 9 | 30 | Connecticut | 72.0% | 81.4% | -9.5 |
| 3 | 17 | 32 | Texas | 71.3% | 78.8% | -7.5 |
| 4 | 19 | 33 | Oklahoma | 70.4% | 77.7% | -7.3 |
| 5 | 33 | 34 | Mississippi | 69.7% | 74.9% | -5.1 |
| 6 | 15 | 26 | Illinois* | 68.7% | 79.9% | -11.2 |
| 7 | 18 | 29 | Maine | 68.6% | 78.4% | -9.7 |
| 8 | 24 | 31 | Louisiana | 68.5% | 76.8% | -8.3 |
| 9 | 11 | 21 | Colorado | 68.2% | 81.1% | -12.9 |
| 10 | 7 | 11 | Wyoming | 67.2% | 83.1% | -15.9 |
| 11 | 10 | 17 | Montana | 67.1% | 81.3% | -14.2 |
| 12 | 6 | 10 | Wisconsin | 66.9% | 83.3% | -16.4 |
| 13 | 12 | 12 | Alaska | 65.6% | 81.0% | -15.4 |
| 14 | 16 | 15 | New York | 65.0% | 79.7% | -14.6 |
| 15 | 8 | 7 | Kansas | 64.4% | 82.5% | -18.0 |
| 15 | 1 | 2 | North Dakota | 64.4% | 88.9% | -24.4 |
| 17 | 32 | 27 | Oregon | 64.0% | 75.0% | -11.0 |
| 18 | 13 | 9 | Rhode Island | 63.9% | 80.8% | -16.9 |
| 19 | 30 | 25 | Florida | 63.8% | 75.4% | -11.6 |
| 19 | 21 | 19 | Idaho | 63.8% | 77.0% | -13.2 |
| 21 | 34 | 28 | Alabama | 63.6% | 73.9% | -10.3 |
| 21 | 23 | 19 | Washington | 63.6% | 76.8% | -13.2 |
| 23 | 28 | 23 | Nevada | 63.5% | 75.5% | -12.0 |
| 24 | 28 | 23 | California | 63.4% | 75.5% | -12.0 |
| 24 | 14 | 8 | Massachusetts | 63.4% | 80.7% | -17.3 |
| 26 | 5 | 4 | Iowa | 62.9% | 84.8% | -21.9 |
| 27 | 26 | 18 | New Mexico | 62.5% | 75.8% | -13.3 |
| 28 | 21 | 14 | North Carolina | 62.2% | 77.0% | -14.7 |
| 29 | 4 | 3 | Minnesota | 61.3% | 85.2% | -23.9 |
| 30 | 27 | 16 | South Carolina | 61.1% | 75.6% | -14.5 |
| 31 | 31 | 13 | Michigan | 60.0% | 75.2% | -15.2 |
| 32 | 20 | 5 | Utah | 57.3% | 77.1% | -19.8 |
| 33 | 25 | 5 | Arizona | 56.6% | 76.4% | -19.8 |
| 34 | 2 | 1 | South Dakota | 54.8% | 87.5% | -32.7 |
| States without tribal lands* | 65.8% | 77.8% | -12.0 | |||
| United States | 64.7% | 78.1% | -13.4 |
* Illinois does not have tribal lands; however, because many American Indians were relocated to Chicago in the mid-20th century, we include it in this analysis.
Note: These weighted data include American Indian multiracials and Hispanics of both races, but exclude the foreign born. The table uses "standard competition ranking," wherein items that tie for a position in the ranking receive the same ranking number, and the ranking numbers of all those below them reflect how many competitors rank above them.
Source: Author's analysis of American Community Survey data from Ruggles et al. (2013)
While the states with the highest Native American employment rates were dispersed across the country, the highest white employment rates were concentrated in the Midwest. North Dakota (88.9 percent), South Dakota (87.5 percent), and Nebraska (85.6 percent) had the highest white employment rates. The lowest rates were in Alabama (73.9 percent), Mississippi (74.9 percent), and Oregon (75.0 percent). The lowest white employment rate (Alabama’s 73.9 percent) was slightly higher than Native America’s highest rate (Nebraska’s 73.4 percent).
In every state there was a large, very large, or extremely large Native American–white employment rate disparity among the 25- to 54-year-old population, as depicted in Figure B. In Mississippi the American Indian employment rate was 5.1 percentage points lower than the white rate. This was the smallest disparity. In Oklahoma and Texas the disparity was 7.3 and 7.5 percentage points, respectively.
American Indian–white employment rate gap (in percentage points) among the 25- to 54-year-old population, by state, 2009–2011
| State | Employment-Rate Gap |
|---|---|
| Mississippi | -5.1 |
| Oklahoma | -7.3 |
| Texas | -7.5 |
| Louisiana | -8.3 |
| Connecticut | -9.5 |
| Maine | -9.7 |
| Alabama | -10.3 |
| Oregon | -11.0 |
| Illinois | -11.2 |
| Florida | -11.6 |
| Nevada | -12.0 |
| States without tribal lands | -12.0 |
| California | -12.0 |
| Nebraska | -12.3 |
| Colorado | -12.9 |
| Idaho | -13.2 |
| Washington | -13.2 |
| New Mexico | -13.3 |
| United States | -13.4 |
| Montana | -14.2 |
| South Carolina | -14.5 |
| New York | -14.6 |
| North Carolina | -14.7 |
| Michigan | -15.2 |
| Alaska | -15.4 |
| Wyoming | -15.9 |
| Wisconsin | -16.4 |
| Rhode Island | -16.9 |
| Massachusetts | -17.3 |
| Kansas | -18.0 |
| Arizona | -19.8 |
| Utah | -19.8 |
| Iowa | -21.9 |
| Minnesota | -23.9 |
| North Dakota | -24.4 |
| South Dakota | -32.7 |
Note: These weighted data include American Indian multiracials and Hispanics of both races, but exclude the foreign born.
Source: Author's analysis of data from Ruggles et al. (2013)
The largest disparities were in the Midwest among the states with some of the highest white employment rates. South Dakota had the second-highest white employment rate, but it had the lowest Native American employment rate, yielding an employment rate disparity of 32.7 percentage points. North Dakota had the highest white employment rate, and this rate was 24.4 percentage points above the Native American rate. Minnesota had the fourth-highest white rate, and this rate was 23.9 percentage points above the Native American rate. Further examination is necessary to understand why states with such high white employment rates can have such low Native American rates.
Exploring predictors of Native American employment
The disparities within states mean that the low Native American employment rates are not simply the result of Native Americans being concentrated in states with weak job creation. There must be other factors besides state of residence that explain the low Native American employment rates.
Table 6 displays demographic characteristics of the 25- to 54-year-old American Indian and white populations. It shows that a smaller share of American Indians than whites have bachelor’s or advanced degrees. While 22.4 percent of whites have a bachelor’s degree, the rate for Native Americans is 12.0 percent. As compared with whites, a greater share of American Indians have GEDs or have not completed high school. Of American Indians, 13.5 percent are high school dropouts, compared with 7.1 percent of whites. Generally, the better educated a population, the higher its employment rate. This lower educational attainment of American Indians may help explain their lower employment rate.
Demographic characteristics of the 25- to 54-year-old American Indian and white populations, 2009–2011
| American Indian | White | |
|---|---|---|
| Basic demographics | ||
| Single-race American Indian | 52.0% | n/a |
| Mixed-race American Indian | 48.0% | n/a |
| Latino | 12.5% | 7.2% |
| Male | 46.7% | 49.6% |
| Average age | 39.6 | 40.2 |
| Personal characteristics | ||
| Married | 45.3% | 60.4% |
| Separated, divorced, widowed | 22.7% | 16.7% |
| Never married | 32.0% | 22.9% |
| Average number of children | 1.0 | 1.0 |
| Veteran | 8.0% | 6.2% |
| Has a disability | 19.3% | 9.5% |
| Human capital | ||
| Speaks only English at home | 83.7% | 93.4% |
| Less than high school diploma | 13.5% | 7.1% |
| GED | 6.7% | 4.3% |
| High school diploma | 23.0% | 22.5% |
| Some college | 30.1% | 23.3% |
| Associate degree | 9.4% | 9.7% |
| Bachelor’s degree | 12.0% | 22.4% |
| Advanced degree | 5.4% | 10.8% |
| Urbanicity and reservation status | ||
| Central city | 13.6% | 10.8% |
| Suburbs | 21.0% | 32.1% |
| Lives on or close to a reservation | 46.9% | 18.8% |
Note: These weighted data include American Indian multiracials and Hispanics of both races, but exclude the foreign born.
Source: Author's analysis of American Community Survey data from Ruggles et al. (2013)
In the mainstream U.S. economy, facility with spoken English is a plus. As compared with whites, a smaller share of American Indians speak only English at home. This raises the possibility that there may be more American Indians than whites who are relatively disadvantaged because of a lower level of facility with English. If true, this may contribute to the lower American Indian employment rate.
Also, a greater share of Native Americans than whites has a disability. Individuals with disabilities are less likely to be employed. This factor may help explain Native Americans’ lower employment rate. Additionally, a greater share of Native Americans lives on or near reservations. Because reservations tend to have worse economies than off-reservation spaces, this factor too may contribute to the low American Indian employment rate.
We now turn to a multivariate analysis that examines how the odds of being employed are affected by the state of residence, the factors just discussed (i.e., educational attainment, facility with English, disability, and living on or near a reservation), as well as other factors listed in Table 6 (i.e., age, sex, Hispanic ethnicity, veteran status, number of children, marital status, and urbanicity). This analysis will allow us to assess whether all of these factors simultaneously might explain Native Americans’ lower probability of being employed.
All of the factors included in the analysis together do not explain why American Indians are less likely to be employed than whites. Controlling for all the factors, prime-working-age Native Americans still have 31 percent lower odds of being employed than similar whites (see Appendix Table A for the full logistic regression results). In other words, even when Native Americans are the same age and sex, have the same education level and marital status, reside in a city in the same state, and are similar to whites on all of the other variables in the analysis, Native Americans still have 31 percent lower odds of being employed than whites.
There is much that we do not fully understand about American Indians’ low employment rates. But the preceding analysis demonstrates that a number of factors that come to mind do not fully explain the phenomenon; it is not just a result of low education levels or residing on a reservation. The analysis leaves open the possibility that racial discrimination may play a role.
By conducting a second analysis and examining how the factors interact with American Indian status (see Appendix Table B for the full results), we can gain a deeper insight into which ones might most promote or hinder Native American employment. Table 7 shows how various demographic factors affect prime-working-age Native Americans’ odds of being employed. For example, the first row shows that Latino status increases the odds of employment by 28 percent. This means that after taking into account all of the other factors in the table, an American Indian who also identifies as Latino has greater odds of being employed than an otherwise similar American Indian who does not identify as Latino.5
Various demographic factors' effects on odds of American Indians being employed, ages 25–54, 2009–2011
| Percent increase/decrease in odds of employment, relative to reference category* |
|
|---|---|
| Basic demographics | |
| Latino | 28% |
| Male | 48% |
| Agea | 7% |
| Age squareda | 0% |
| Personal characteristics | |
| Marriedb | 19% |
| Never marriedb | -22% |
| Number of childrena | -1% |
| Veteran | 20% |
| Has a disability | -78% |
| Human capital | |
| Speaks only English at home | 15% |
| GEDc | 50% |
| High school diplomac | 108% |
| Some collegec | 192% |
| Associate degreec | 269% |
| Bachelor’s degreec | 427% |
| Advanced degreec | 607% |
| Urbanicity and reservation status | |
| Central cityd | -4% |
| Suburband | 14% |
| Lives on or close to a reservation | -7% |
| State of residence (reference: states without tribal lands) | |
| Alabama | -10% |
| Alaska | 0% |
| Arizona | -29% |
| California | -24% |
| Colorado | 0% |
| Connecticut | 6% |
| Florida | -12% |
| Idaho | -5% |
| Illinoise | 0% |
| Iowa | 0% |
| Kansas | 30% |
| Louisiana | 3% |
| Maine | 0% |
| Massachusetts | 0% |
| Michigan | -16% |
| Minnesota | 0% |
| Mississippi | 50% |
| Montana | -11% |
| Nebraska | 64% |
| Nevada | -14% |
| New Mexico | -10% |
| New York | 0% |
| North Carolina | -9% |
| North Dakota | -13% |
| Oklahoma | 25% |
| Oregon | 2% |
| Rhode Island | 13% |
| South Carolina | -9% |
| South Dakota | -24% |
| Texas | 4% |
| Utah | -32% |
| Washington | -13% |
| Wisconsin | 8% |
| Wyoming | 33% |
* Except where otherwise noted, the reference category is the opposite of the category indicated in the table. For example, female is the reference category for male, non-Latino is the reference category for Latino, etc. Reference categories are otherwise demographically similar to the categories indicated in the table.
a There is no reference category for these variables.
b The reference category is separated, divorced, or widowed.
c The reference category is less than a high school diploma.
d The reference category is central city status unknown, not in a metropolitan area, and metropolitan status not identifiable.
e Illinois does not have tribal lands; however, because many American Indians were relocated to Chicago in the mid-20th century, we include it in this analysis.
Note: Percent increase/decrease in odds are derived from odds ratios for the sum of the main and interaction effects. Categories where the change in likelihood is not statistically significant are indicated as having a 0 percent change. These data include American Indian multiracials and Hispanic American Indians, but exclude the foreign born.
Source: Author's analysis of American Community Survey data from Ruggles et al. (2013)
Education and English
The factor that does the most to increase American Indians’ odds of employment is higher education. As shown in Table 7, American Indians with advanced degrees have seven times the odds of American Indians with less than a high school education. The odds decline for each step down in educational attainment, but even American Indian GED holders have about 50 percent greater odds of being employed than otherwise similar American Indians with less education. American Indians who speak only English at home have 15 percent higher odds of being employed than those who do not.
States and reservations
Table 7 also shows the change in American Indians’ odds of being employed in a particular state relative to otherwise similar American Indians in states without tribal lands. After taking all other factors in the analysis into consideration, Native Americans residing in Nebraska, Mississippi, and Wyoming receive the biggest increases in their odds of being employed relative to Native Americans in states without tribal lands, with increases of 64 percent, 50 percent, and 33 percent, respectively.
The states that lower Native Americans’ odds of employment the most are Utah, Arizona, South Dakota, and California. In Utah, American Indians’ employment odds are 32 percent lower than those of otherwise similar Native Americans in states without tribal lands, compared with reductions of 29 percent in Arizona and 24 percent in both South Dakota and California.
As Table 6 illustrates, a majority of Native Americans do not live on or near a reservation. Thus, for most Native Americans, the lack of job opportunities on a reservation cannot explain their relatively low odds of finding employment. However, as one might expect, living on or near a reservation reduces Native Americans’ odds of finding employment (by 7 percent). When one considers all the other factors in the analysis, reservation status is important, but is one of the less influential factors explaining the Native American employment rate.
Differences between Native Americans and whites within the same state
The state portion of Table 7 shows how the odds of employment among Native Americans in a particular state compare with those of otherwise similar Native Americans in states without tribal lands. Native Americans can do better or worse relative to states without tribal lands because a particular state has a strong or weak economy. Native Americans can also do better or worse because within a particular state there are some unmeasured qualities or circumstances that make them do better or worse than whites in that particular state.
Table 8 allows us to compare prime-working-age American Indians and whites within the same state after controlling for the other factors. We begin with the same Native American state data from Table 7. We then add the comparable data for whites. For example, for both American Indians and whites, residing in Alabama reduces one’s odds of employment by 10 percent (relative to living in a state without tribal lands). In comparison, residing in Arizona reduces American Indians’ odds of employment by 29 percent, compared with a 12 percent reduction for whites. Thus, there is something about being an American Indian in Arizona that makes it worse in terms of employment odds than being white in Arizona.
Change in odds of employment caused by state of residence for American Indians and whites (relative to states without tribal lands), ages 25–54, 2009–2011
| State | American Indian* | White** | Difference (American Indian – white) |
|---|---|---|---|
| Alabama | -10% | -10% | 0 |
| Alaska | 0% | 0% | 0 |
| Arizona | -29% | -12% | -17 |
| California | -24% | -24% | 0 |
| Colorado | 0% | 0% | 0 |
| Connecticut | 6% | 6% | 0 |
| Florida | -12% | -12% | 0 |
| Idaho | -5% | -5% | 0 |
| Illinois*** | 0% | 0% | 0 |
| Iowa | 0% | 59% | -59 |
| Kansas | 30% | 30% | 0 |
| Louisiana | 3% | 3% | 0 |
| Maine | 0% | 0% | 0 |
| Massachusetts | 0% | 0% | 0 |
| Michigan | -16% | -16% | 0 |
| Minnesota | 0% | 42% | -42 |
| Mississippi | 50% | -6% | 56 |
| Montana | -11% | 18% | -29 |
| Nebraska | 64% | 64% | 0 |
| Nevada | -14% | -14% | 0 |
| New Mexico | -10% | -10% | 0 |
| New York | 0% | 0% | 0 |
| North Carolina | -9% | -9% | 0 |
| North Dakota | -13% | 90% | -103 |
| Oklahoma | 25% | 7% | 18 |
| Oregon | 2% | -19% | 20 |
| Rhode Island | 13% | 13% | 0 |
| South Carolina | -9% | -9% | 0 |
| South Dakota | -24% | 102% | -126 |
| Texas | 4% | 4% | 0 |
| Utah | -32% | -15% | -17 |
| Washington | -13% | -13% | 0 |
| Wisconsin | 8% | 38% | -30 |
| Wyoming | 33% | 33% | 0 |
* Change in American Indians' odds of employment in a particular state relative to employment odds of demographically similar American Indians in states without tribal lands
** Change in whites' odds of employment in a particular state relative to employment odds of demographically similar whites in states without tribal lands
*** Illinois does not have tribal lands; however, because many American Indians were relocated to Chicago in the mid-20th century, we include it in this analysis.
Note: Odds control for gender, age, marital status, number of children, veteran status, disability, facility with English, educational attainment, urbanicity, and proximity to a reservation. All states where there is no statistically significant difference between the state's effect on American Indian employment odds and white employment odds have a difference of 0 percentage points. These data include American Indian multiracials and Hispanics of both races, but exclude the foreign born.
Source: Author's analysis of American Community Survey data from Ruggles et al. (2013)
We can compare the conditions for American Indians and whites in a state more easily by subtracting the white column from the American Indian column. All states where there is no statistically significant difference between the state’s effect on the employment odds of American Indians and of whites now have a value of zero. States where American Indians perform better than whites (when all else is equal) have positive values. States where American Indians perform worse than whites (when all else is equal) have negative values.
American Indians do surprisingly well relative to whites in three states: Mississippi, Oregon, and Oklahoma. In Mississippi, American Indians have 50 percent higher odds of being employed, while whites have 6 percent lower odds. In Oregon, American Indians only have 2 percent higher odds of being employed, but whites have 19 percent lower odds. In Oklahoma, American Indians have 25 percent higher odds of being employed, while whites only have 7 percent higher odds. There is something positive occurring for Native Americans in these three states. These states may hold lessons about what can be done to improve Native American employment outcomes more generally.
There are eight states where American Indians perform worse relative to whites in the state. These states are, in declining order of the size of the disparity, South Dakota, North Dakota, Iowa, Minnesota, Wisconsin, Montana, Utah, and Arizona. In South Dakota, American Indians experience a 24 percent reduction in the odds of employment, while whites experience a 102 percent increase. The situation in North Dakota is very similar; American Indians’ odds are reduced 13 percent, while whites’ odds are increased 90 percent. In Iowa, American Indians have no increase or decrease in odds, but whites have a 59 percent increase.
While these states have large disparities, they may also present an opportunity to increase the American Indian employment rate. If American Indians had employment odds equal to those of whites in these states, overall American Indian employment would be boosted substantially.
Exploring tribal employment
The tribal employment data presented in this section of the paper must be used with caution because of several issues that potentially compromise its accuracy. The samples by tribe are quite small; therefore, sampling limitations and problems in the American Community Survey, the data source upon which these analyses are based, can be magnified. Because of this issue, employment rate estimates may be off significantly (see Schmitt and Baker 2006; DeWeaver 2010; National Congress of American Indians Policy Research Center 2013). Additionally, the coding of the data on tribal enrollment appears to have inaccuracies.6 Thus, the data presented here are, at best, only very rough exploratory data; however, they are, to the author’s knowledge, the only readily accessible recent (post-2005) estimates of tribal labor force conditions.
Table 9 shows the employment rate estimates for prime-working-age individuals living on or near a reservation by reported tribal enrollment. As explained in endnote 6, the data are limited to individuals in one state except for the Yuman and the Navajo. The states are listed in parentheses.
Employment rates of tribal members living on or close to reservations or other tribal lands, ages 25–54, 2009–2011
| Rank | Tribe (state) | Rate |
|---|---|---|
| 1 | Tlingit-Haida (Alaska) | 75.8% |
| 2 | Cherokee (Oklahoma) | 72.9% |
| 3 | Choctaw (Oklahoma) | 72.3% |
| 4 | Cheyenne (Montana) | 71.5% |
| 5 | Crow (Montana) | 68.8% |
| 6 | Iroquois (New York) | 68.4% |
| 7 | Creek (Oklahoma) | 66.9% |
| 8 | Chickasaw (Oklahoma) | 65.8% |
| 9 | Aleut (Alaska) | 65.7% |
| 9 | Comanche (Oklahoma) | 65.7% |
| 11 | Blackfoot (Montana) | 65.6% |
| 12 | Potawatomi (Oklahoma) | 63.6% |
| 13 | Colville (Washington) | 63.1% |
| 13 | Pueblo (New Mexico) | 63.1% |
| 15 | Menominee (Wisconsin) | 62.7% |
| 16 | Other Alaska Native (Alaska) | 62.6% |
| 17 | Iowa (Louisiana) | 62.3% |
| 18 | Lumbee (North Carolina) | 62.2% |
| 19 | Alaskan Athabaskan (Alaska) | 61.2% |
| 20 | Yuman (Arizona, California) | 60.9% |
| 21 | Eskimo (Alaska) | 59.3% |
| 22 | Delaware (Oklahoma) | 58.5% |
| 23 | Paiute (Nevada) | 58.4% |
| 24 | Seminole (Oklahoma) | 57.3% |
| 25 | Chippewa (Minnesota) | 56.6% |
| 26 | Navajo (New Mexico, Arizona, Utah) | 55.8% |
| 27 | Sioux (South Dakota) | 53.5% |
| 28 | Yaqui (Arizona) | 51.9% |
| 29 | Yakima (Washington) | 50.9% |
| 30 | Puget Sound Salish (Washington) | 49.4% |
| 31 | Apache (Arizona) | 48.4% |
| 32 | Tohono O’Odham (Arizona) | 42.6% |
| 33 | Pima (Arizona) | 42.5% |
| Subsample average | 60.3% |
Note: These rates are not necessarily of only one reservation. These weighted data include American Indian multiracials and Hispanic American Indians, but exclude the foreign born. The table uses "standard competition ranking," wherein items that tie for a position in the ranking receive the same ranking number, and the ranking numbers of all those below them reflect how many competitors rank above them.
Source: Author's analysis of American Community Survey data from Ruggles et al. (2013)
At 75.8 percent, the Tlingit-Haida tribe has the highest employment rate. This rate is relatively close to the white national average rate of 78.1 percent. The Cherokee (72.9 percent), Choctaw (72.3 percent), and Cheyenne (71.5 percent) all have employment rates exceeding 70 percent. These rates are considerably higher than the overall reservation employment rate of 63.4 percent (see Table 4) or the 60.3 percent average rate for the tribal subsample discussed in this section.
The three tribes with the lowest employment rates are all in Arizona: the Pima (42.5 percent), the Tohono O’Odham (42.6 percent), and the Apache (48.4 percent). These rates are much lower than the average for the subsample. They also indicate that less than half of the prime-age population in these tribes is working.
A tribe can have a high or low employment rate due to something unmeasured about the tribe or because of some other factor correlated with membership in the tribe. For example, the average age of a particular tribe may be higher than that of other tribes. Older individuals are more likely to be employed, and that fact may lift the tribe’s employment rate. Also, the educational distribution of tribes may differ. Tribes with higher levels of education would be expected to have higher employment rates. The multivariate analysis allows us to take age, education, and other factors into account to see if there is any additional effect due to tribal membership.
Table 10 presents the percent increase or decrease in the odds of employment for each tribe, relative to Navajo membership. The Navajo were chosen as the reference group simply because they are the largest. Tribes for which there is no statistically significant change in odds are shown as having a 0 percent change. After controlling for other factors, members of the Tlingit-Haida tribe continue to have the highest odds of employment. The effect is 86 percent greater than membership in the Navajo tribe. Membership in the Aleut, Cherokee, and Choctaw tribes also has strong positive effects on the odds of employment relative to the Navajo tribe. These tribes potentially have lessons that could be shared to help improve the employment rates of American Indians generally.
Effect of tribal membership on odds of being employed (relative to Navajo membership),* ages 25–54, 2009–2011
| Tribe (state) | Percent increase/decrease in odds of employment relative to Navajo membership* |
|---|---|
| Tlingit-Haida (Alaska) | 86% |
| Aleut (Alaska) | 67% |
| Cherokee (Oklahoma) | 67% |
| Choctaw (Oklahoma) | 66% |
| Potawatomi (Oklahoma) | 0% |
| Iowa (Louisiana) | 0% |
| Pueblo (New Mexico) | 53% |
| Lumbee (North Carolina) | 44% |
| Creek (Oklahoma) | 43% |
| Iroquois (New York) | 0% |
| Seminole (Oklahoma) | 0% |
| Yuman (Arizona, California) | 0% |
| Chickasaw (Oklahoma) | 0% |
| Menominee (Wisconsin) | 0% |
| Chippewa (Minnesota) | 31% |
| Eskimo (Alaska) | 29% |
| Comanche (Oklahoma) | 0% |
| Crow (Montana) | 0% |
| Yaqui (Arizona) | 0% |
| Alaskan Athabaskan (Alaska) | 0% |
| Blackfoot (Montana) | 0% |
| Delaware (Oklahoma) | 0% |
| Cheyenne (Montana) | 0% |
| Other Alaska Native (Alaska) | 0% |
| Yakima (Washington) | 0% |
| Sioux (South Dakota) | 0% |
| Colville (Washington) | 0% |
| Pima (Arizona) | 0% |
| Puget Sound Salish (Washington) | 0% |
| Tohono O’Odham (Arizona) | 0% |
| Apache (Arizona) | 0% |
| Paiute (Nevada) | 0% |
* Navajo is chosen as the reference category because it is the largest tribe.
Note: These rates are not necessarily of only one reservation. These data include American Indian multiracials and Hispanic American Indians, but exclude the foreign born. Odds control for gender, age, marital status, number of children, veteran status, disability, facility with English, educational attainment, and urbanicity. Tribes where the change in likelihood is not statistically significant are indicated as having a 0 percent change.
Source: Author's analysis of American Community Survey data from Ruggles et al. (2013)
Part II: Policies to increase the Native American employment rate
It is clear that Native Americans suffer from a deep employment crisis. Nationally, their employment rate is extremely low. While there are many Native American communities by state or by tribe that are faring even worse than average, many are also doing better than average. In this part of the paper, we make recommendations based on what lessons can be learned from the prior data analysis and from some of the research on economic development for Native Americans and other groups.
Support strong Native American self-determination and leadership
American Indians and Alaska Natives have access to substantial natural resources. Reservations contain millions of acres of commercial timber, important plant and animal life, and vast mineral resources (National Congress of American Indians 2013b). A number of current policies, however, prevent tribes from being able to develop these natural resources as would a state or local government (National Congress of American Indians 2013b). The federal trust management system needs to be reformed to allow tribes greater ability to use their natural resources for economic development (National Native American Economic Policy Summit 2007, 7–8).
More generally, researchers Stephen Cornell and Joseph P. Kalt (2000) found that strong and culturally appropriate tribal leadership is associated with higher employment rates. In their analysis, tribes governed by a chief executive or a legislature, typically a parliamentary tribal council, had better employment outcomes than tribes governed by a general council. The researchers also found that for the tribal government to be effective, it needed to be based on the cultural traditions of the tribe and not simply on forms that were at one time imposed by the federal government.
Increase the number of, and strengthen, Native American community development financial institutions
Many reservations lack access to capital, credit, and financial services (U.S. Department of the Treasury 2001), which stifles entrepreneurship and other economic development activities that lead to job creation. Native American community development financial institutions (CDFI) are an important solution to this problem. The Four Bands Community Fund, a Native American CDFI in Eagle Butte, S.D., illustrates some of the potential of these institutions. Four Bands has “served nearly 4,000 clients and disbursed approximately 580 microloans, small business loans, and credit-builder loans totaling $4.1 million” (Fiddler 2013). It has also “contributed to the establishment or expansion of more than 100 Native-owned businesses and the creation or retention of more than 400 jobs on the Cheyenne River Indian Reservation” (Fiddler 2013). More and stronger Native American CDFIs would facilitate Native American economic self-determination through wealth-building and entrepreneurship.
Investigate the states and tribes in the best employment situations
The analysis in Part I shows that there are some states and tribes where Native Americans are receiving significant boosts to their odds of employment. After one takes into account demographic, personal, human capital, urbanicity, and reservation-status factors, residence in Mississippi, Oregon, and Oklahoma appears to improve Native Americans’ odds of employment relative to those of whites.
What is occurring in these states, and can it be replicated? Is it due to state policies, tribal policies, fortuitous economic circumstances, or something else? As is often the case with research, the findings of this study lead to new, important questions.
Among tribes, the limited data available suggest that the Tlingit-Haida, Aleut, Cherokee, Choctaw, Pueblo, Lumbee, Creek, Chippewa, and Eskimo tribes had relatively high odds of being employed. As with the states where Native Americans are doing relatively well, these tribes need to be investigated further to understand why they are faring better than most other tribes. Their successes may be transferable to American Indians more broadly.
Investigate the states with the worst employment situations
Native Americans’ difficulties in the labor market are not due just to differences in educational attainment, English ability, basic demographic factors, personal characteristics, urbanicity, and reservation status. Even after taking these factors into account, Native Americans still did particularly poorly in some states relative to whites.
These states may also present an opportunity to improve Native American employment outcomes. There may be situations where there are job opportunities in a state, but for some perhaps easily addressed reason, Native Americans are blocked from those opportunities. South Dakota, North Dakota, Iowa, Minnesota, Wisconsin, Montana, Utah, and Arizona are all such states. If we can better understand what the cause is, we may be able to address it and equalize Native American and white employment outcomes.
Improve Native American education outcomes
Of all the variables in the analysis in Part I, the educational attainment variables produced the largest positive effect on the odds of employment. Policies that can increase Native American educational attainment appear to have strong potential for improving the employment rates of American Indians.
There are many policies that may be effective at accomplishing this. Educational attainment is a product of not just a child and the child’s school, but also the family and community resources available to the child. Children from disadvantaged socioeconomic backgrounds tend to do worse in school than middle-class children precisely because they come from disadvantaged socioeconomic backgrounds (Lee and Burkam 2002). It is necessary to improve family and community resources to enable children to do their best in school. What follows are several ways to achieve this:
Improve maternal and child health: There are lessons for Native Americans from research on African Americans. While black students perform worse than white students on standardized tests, black test scores have improved over time, and the black–white test score gap narrowed considerably over the 1980s. Recent research suggests that this narrowing was due to improved neonatal health outcomes for black children following the desegregation of hospitals in the 1960s. The researchers conclude that “investments in health through increased access at very early ages have large, long-term effects on [educational] achievement” (Chay, Guryan, and Mazumder 2009).
A larger proportion of Native Americans than whites are uninsured, and they fare poorly on health access measures. Native Americans who have health coverage through the federally funded Indian Health Service have low rates of contact with health professionals (James, Schwartz, and Berndt 2009). The post-neonatal mortality rate of Native Americans is about twice that of whites (National Center for Health Statistics 2013). Improvement of the maternal and child health of Native Americans is likely to improve the educational performance of Native American children.
Provide high-quality early childhood education: Research has shown that high-quality early childhood education can have long-term positive impacts on educational attainment. The best programs increase the likelihood of high school and college completion (Barnett and Belfield 2006). American Indian three- and four-year-olds have one of the lowest rates of preschool enrollment. Over 2009–2011, 58 percent of American Indian children were not enrolled in preschool, compared with 50 percent of non-Hispanic white children (Kids Count Data Center 2012). For the American Indians who are enrolled in preschool, one has to wonder about the relative quality of their preschools compared with those of whites. The data suggest that whites have access to better quality early childhood education than nonwhites (Lee and Burkam 2002). To improve Native American children’s educational outcomes, they would need not simply higher preschool enrollment, but enrollment in high-quality preschools. A high-quality preschool for Native Americans would also have to be respectful of Native American culture and history.
Maximize the number of regular high school diplomas: One-fifth (20.1 percent) of prime-age Native Americans do not have a regular high school diploma, compared with about one-tenth (11.3 percent) of whites (Table 6). Native Americans who obtain regular high school diplomas have higher odds of finding employment than those who drop out of high school and those who obtain GEDs. The National Dropout Prevention Center/Network (n.d.) has identified 14 dropout prevention strategies in addition to early childhood education that Native American organizations and advocates can explore to address this problem. Preventing students from dropping out of high school may be the employment policy with the lowest upfront costs since some of the programs involve reforming and adding to already existing educational institutions.
Increase the number and size of tribal programs supporting higher education: The National Congress of American Indians Policy Research Center (2012) has assembled examples of tribal programs to support the higher education and training of tribal members. These programs help tribes develop the human capital necessary for their economic development. They also potentially provide role models and mentors to encourage others to pursue higher education.
For example, as the NCAI Policy Research Center reports, the Old Harbor Tribal Council’s Undergraduate Specialized Academic Award requires students receiving the scholarship to work with youth in the tribe so they can “help to expand youths’ visions of what is possible and inspire them to likewise pursue higher education.” The more highly educated adults there are in a community, the more children will aspire to be highly educated when they become adults.
Investigate the role of racial discrimination
The fact that Native Americans have lower odds of being employed even after controlling for age, education, state of residence, reservation residence, urbanicity, marital status, disability status, and other factors leaves open the possibility that Native Americans may face racial discrimination in the labor market. Paired-tester or audit studies, in which researchers pair white and nonwhite “testers” to present equivalent applications to the same employers, show that black and Latino job candidates are less likely than equally qualified whites to receive positive responses from employers (Pager, Western, and Bonikowski 2009). As such, it would not be surprising for Native American job applicants to also face discrimination in the labor market.
There should be research employing the paired-tester methodology to investigate whether this is indeed the case. It would be useful to conduct this research in the states where Native Americans have the lowest odds of employment relative to whites: South Dakota, North Dakota, Iowa, Minnesota, Wisconsin, Montana, Utah, and Arizona.
Improve the tribal labor market data
Understanding and improving the economic conditions of Native Americans requires good data. Unfortunately, there are questions about the accuracy of American Community Survey (ACS) data nationally. Research commissioned by the National Congress of American Indians has found that the ACS counts differ from the Census (DeWeaver 2010; National Congress of American Indians Policy Research Center 2013). The tribal-level data in the ACS appear to have coding inaccuracies, and do not have sufficient detail to study labor market conditions on many reservations in a timely fashion.
There should be additional research to assess the accuracy of the ACS data for studying Native Americans. It seems that it will be necessary for surveys to be designed specifically to collect tribal-level data.
Conclusion
Native Americans face clear economic challenges. Their employment rates are far below those of whites, both in the country overall and at the state level—and Native Americans have lower odds of employment than whites even after accounting for various demographic factors. At the same time, however, the path forward is also clear. Through empowering Native American communities, providing them with the necessary financial resources, improving Native American education outcomes, and conducting additional research on Native Americans’ economic circumstances, we can begin to surmount these challenges. In short, the challenge is great—but so is the promise. We can point to a growing number of tribes where not only are the majority of members working, but where the tribe also contributes positively to the local economy.
About the author
Algernon Austin directs the Economic Policy Institute’s Program on Race, Ethnicity and the Economy (PREE). PREE works to advance policies that enable people of color to participate fully in the American economy and benefit equitably from gains in prosperity. As director of PREE, Austin oversees reports and policy analyses on the economic condition of America’s people of color. Prior to joining the Economic Policy Institute, Austin was a senior fellow at Dēmos and assistant director of research at the Foundation Center. He received his Ph.D. in sociology from Northwestern University.
Logistic regression analysis of odds of being employed among American Indians and whites, ages 25–54, 2009–2011
| Odds ratio | Statistical significance | |
|---|---|---|
| Basic demographics | ||
| American Indiana | 0.694 | *** |
| Latino | 1.124 | *** |
| Male | 2.238 | *** |
| Age | 1.073 | *** |
| Age squared | 0.999 | *** |
| Personal characteristics | ||
| Marriedb | 1.122 | *** |
| Never marriedb | 0.778 | *** |
| Number of children | 0.883 | *** |
| Veteran | 1.107 | *** |
| Has a disability | 0.179 | *** |
| Human capital | ||
| Speaks only English at home | 1.075 | *** |
| GEDc | 1.497 | *** |
| High school diplomac | 2.415 | *** |
| Some collegec | 2.925 | *** |
| Associate degreec | 4.144 | *** |
| Bachelor’s degreec | 4.385 | *** |
| Advanced degreec | 7.078 | *** |
| Urbanicity and reservation status | ||
| Central cityd | 0.969 | *** |
| Suburband | 1.014 | *** |
| Lives on or close to a reservation | 0.983 | ** |
| State of residence (reference: states without tribal lands) | ||
| Alabama | 0.909 | *** |
| Alaska | 0.977 | |
| Arizona | 0.851 | *** |
| California | 0.760 | *** |
| Colorado | 1.018 | |
| Connecticut | 1.059 | *** |
| Florida | 0.882 | *** |
| Idaho | 0.949 | * |
| Illinoise | 1.006 | |
| Iowa | 1.582 | *** |
| Kansas | 1.289 | *** |
| Louisiana | 1.037 | * |
| Maine | 1.039 | |
| Massachusetts | 1.019 | |
| Michigan | 0.840 | *** |
| Minnesota | 1.406 | *** |
| Mississippi | 0.952 | ** |
| Montana | 1.145 | *** |
| Nebraska | 1.628 | *** |
| Nevada | 0.860 | *** |
| New Mexico | 0.891 | *** |
| New York | 0.987 | |
| North Carolina | 0.917 | *** |
| North Dakota | 1.773 | *** |
| Oklahoma | 1.101 | *** |
| Oregon | 0.822 | *** |
| Rhode Island | 1.129 | *** |
| South Carolina | 0.909 | *** |
| South Dakota | 1.756 | *** |
| Texas | 1.037 | *** |
| Utah | 0.846 | *** |
| Washington | 0.874 | *** |
| Wisconsin | 1.373 | *** |
| Wyoming | 1.332 | *** |
| Log likelihood = -1128355.1 Pseudo R2 = 0.1241 |
||
| Number of obs = 2,459,829 | ||
* p<.05; ** p<.01; *** p<.001; robust standard errors
a Includes multiracial individuals. The reference category is white.
b The reference category is separated, divorced, or widowed.
c The reference category is less than a high school diploma.
d The reference category is central city status unknown, not in a metropolitan area, and metropolitan status not identifiable.
e Illinois does not have tribal lands; however, because many American Indians were relocated to Chicago in the mid-20th century, we include it in this analysis.
Note: These data include American Indian multiracials and Hispanics of both races, but exclude the foreign born.
Source: Author's analysis of American Community Survey data from Ruggles et al. (2013)
Logistic regression analysis of odds of being employed among American Indians and whites, with interactions, ages 25–54, 2009–2011
| Odds ratios | Statistical significance | |
|---|---|---|
| Basic demographics | ||
| American Indiana | 0.422 | *** |
| Latino | 1.101 | *** |
| Male | 2.269 | *** |
| Age | 1.073 | *** |
| Age squared | 0.999 | *** |
| Personal characteristics | ||
| Marriedb | 1.121 | *** |
| Never marriedb | 0.780 | *** |
| Number of children | 0.879 | *** |
| Veteran | 1.103 | *** |
| Has a disability | 0.177 | *** |
| Human capital | ||
| Speaks only English at home | 1.051 | *** |
| GEDc | 1.497 | *** |
| High school diplomac | 2.426 | *** |
| Some collegec | 2.925 | *** |
| Associate degreec | 4.152 | *** |
| Bachelor’s degreec | 4.369 | *** |
| Advanced degreec | 7.066 | *** |
| Urbanicity and reservation status | ||
| Central cityd | 0.965 | *** |
| Suburband | 1.013 | ** |
| Lives on or close to a reservation | 0.988 | * |
| State of residence (reference: states without tribal lands) | ||
| Alabama | 0.904 | *** |
| Alaska | 1.063 | |
| Arizona | 0.882 | *** |
| California | 0.759 | *** |
| Colorado | 1.018 | |
| Connecticut | 1.058 | ** |
| Florida | 0.881 | *** |
| Idaho | 0.947 | * |
| Illinoise | 1.007 | |
| Iowa | 1.591 | *** |
| Kansas | 1.295 | *** |
| Louisiana | 1.030 | * |
| Maine | 1.037 | |
| Massachusetts | 1.021 | |
| Michigan | 0.838 | *** |
| Minnesota | 1.418 | *** |
| Mississippi | 0.943 | ** |
| Montana | 1.179 | *** |
| Nebraska | 1.638 | *** |
| Nevada | 0.856 | *** |
| New Mexico | 0.900 | *** |
| New York | 0.987 | |
| North Carolina | 0.914 | *** |
| North Dakota | 1.895 | *** |
| Oklahoma | 1.069 | *** |
| Oregon | 0.813 | *** |
| Rhode Island | 1.126 | *** |
| South Carolina | 0.907 | *** |
| South Dakota | 2.018 | *** |
| Texas | 1.036 | *** |
| Utah | 0.852 | *** |
| Washington | 0.871 | *** |
| Wisconsin | 1.377 | *** |
| Wyoming | 1.333 | *** |
Interactions |
||
| Basic demographics x American Indian | ||
| Latino | 1.159 | *** |
| Male | 0.654 | *** |
| Age | 1.020 | |
| Age squared | 1.000 | |
| Personal characteristics x American Indian | ||
| Marriedb | 1.062 | * |
| Never marriedb | 1.000 | |
| Number of children | 1.129 | *** |
| Veteran | 1.089 | * |
| Has a disability | 1.263 | *** |
| Human capital x American Indian | ||
| Speaks only English at home | 1.089 | ** |
| GEDc | 0.992 | |
| High school diplomac | 0.859 | *** |
| Some collegec | 0.952 | |
| Associate degreec | 0.888 | ** |
| Bachelor’s degreec | 1.207 | *** |
| Advanced degreec | 1.096 | |
| Urbanicity x American Indian and reservation status x American Indian | ||
| Central cityd | 1.071 | |
| Suburband | 1.124 | *** |
| Lives on or close to a reservation | 0.937 | * |
| State of residence x American Indian (reference: states without tribal lands) | ||
| Alabama | 1.186 | |
| Alaska | 0.879 | |
| Arizona | 0.809 | *** |
| California | 0.988 | |
| Colorado | 0.965 | |
| Connecticut | 0.994 | |
| Florida | 1.050 | |
| Idaho | 1.052 | |
| Illinoise | 0.947 | |
| Iowa | 0.627 | ** |
| Kansas | 0.863 | |
| Louisiana | 1.215 | |
| Maine | 0.985 | |
| Massachusetts | 0.864 | |
| Michigan | 1.065 | |
| Minnesota | 0.705 | *** |
| Mississippi | 1.590 | ** |
| Montana | 0.752 | ** |
| Nebraska | 0.763 | |
| Nevada | 1.071 | |
| New Mexico | 1.048 | |
| New York | 0.934 | |
| North Carolina | 1.055 | |
| North Dakota | 0.459 | *** |
| Oklahoma | 1.168 | ** |
| Oregon | 1.251 | ** |
| Rhode Island | 1.082 | |
| South Carolina | 1.147 | |
| South Dakota | 0.375 | *** |
| Texas | 1.100 | |
| Utah | 0.801 | * |
| Washington | 1.035 | |
| Wisconsin | 0.782 | ** |
| Wyoming | 0.941 | |
| Log pseudolikelihood = -1127592.1 Pseudo R2 = 0.1247 | ||
| Number of obs = 2,459,829 | ||
* p<.05; ** p<.01; *** p<.001; robust standard errors
a Includes multiracial individuals. The reference category is white.
b The reference category is separated, divorced, or widowed.
c The reference category is less than a high school diploma.
d The reference category is central city status unknown, not in a metropolitan area, and metropolitan status not identifiable.
e Illinois does not have tribal lands; however, because many American Indians were relocated to Chicago in the mid-20th century, we include it in this analysis.
Note: These data include American Indian multiracials and Hispanics of both races, but exclude the foreign born.
Source: Author's analysis of American Community Survey data from Ruggles et al. (2013)
Endnotes
1. In this paper “American Indian,” “Native American,” and “Native” will be used interchangeably to refer to American Indians and Alaska Natives, including the Hispanic and multiracial American Indian and Alaska Native populations.
2. While the ACS has a relatively large sample of American Indians, there is reason to believe that the survey still underrepresents the most disadvantaged Native Americans (DeWeaver 2010; National Congress of American Indians Policy Research Center 2013). The more disadvantaged a population, the harder the population is to cover in surveys (Schmitt and Baker 2006). It is also important to note that differences in sampling and methodology cause the labor force statistics in the ACS to differ from the Current Population Survey, the source of the statistics produced by the Bureau of Labor Statistics. For these same reasons, ACS statistics will differ from Bureau of Indian Affairs data.
3. Author’s analysis of American Community Survey data from Ruggles et al. (2013).
4. Illinois is included on the recommendation of the National Congress of American Indians.
5. Categories where the change in likelihood is not statistically significant are indicated as having a 0 percent change.
6. For example, individuals who live on a reservation and report a “Cheyenne” tribal membership are concentrated in three different states: Montana, Oklahoma, and South Dakota. It seems that these individuals are members of at least three different tribes: the Northern Cheyenne of Montana, the Cheyenne-Arapaho of Oklahoma, and the Cheyenne River Sioux of South Dakota.
In the tribal employment analyses, the possible coding problem is partially addressed by limiting tribal designations to the state with the greatest number of individuals. For example, the “Cheyenne” designation is limited to individuals on reservations in Montana. The other individuals are dropped from the analysis. In the cases where a reservation is known to span two or more adjacent states, residents from adjacent states are all included as members of the tribe. This only applies to the Yuman, who are assumed to be the Quechan Indians of the Fort Yuma-Quechan Reservation, whose reservation spans California and Arizona (Inter Tribal Council of Arizona, Inc. n.d.), and the Navajo Nation, which spans New Mexico, Arizona, and Utah.
Even if one limits a tribal designation to one state, this does not mean that the data refer to one tribe. For example, within Arizona there are at least four Apache reservations: the San Carlos Apache Tribe, the Tonto Apache Tribe, the White Mountain Apache Tribe, and the Yavapai-Apache Tribe. The Apache data in the analysis in this section, which are restricted to residents of Arizona, then likely pool data from all four of these tribes.
These data problems highlight the need for labor force statistics generated at the tribal level, such as those published by the Bureau of Indian Affairs (BIA) American Indian Population and Labor Force Report. Unfortunately, this BIA report has not been updated since 2005.
References
Austin, Algernon. 2013. “Native Americans Are Still Waiting for an Economic Recovery.” Economic Policy Institute Economic Snapshot, October 29. http://www.epi.org/publication/native-americans-are-still-waiting-for-an-economic-recovery/
Barnett, W. Steven, and Clive R. Belfield. 2006. “Early Childhood Development and Social Mobility.” The Future of Children, vol. 16, no. 2, 73–98.
Chang, Mariko. 2010. Lifting as We Climb: Women of Color, Wealth, and America’s Future. Insight Center for Community Economic Development. http://www.insightcced.org/uploads/CRWG/LiftingAsWeClimb-WomenWealth-Report-InsightCenter-Spring2010.pdf.
Chay, Kenneth Y., Jonathan Guryan, and Bhaskar Mazumder. 2009. Birth Cohort and the Black-White Achievement Gap: The Roles of Access and Health Soon After Birth. National Bureau of Economic Research, Working Paper 15078.
Cornell, Stephen, and Joseph P. Kalt. 2000. “Where’s the Glue: Institutional and Cultural Foundations of American Indian Economic Development.” Journal of Socio-Economics, vol. 29, 443–470.
DeWeaver, Norm. 2010. The American Community Survey: Serious Implications for Indian Country (unpublished white paper). National Congress of American Indians Policy Research Center.
Fiddler, Tanya. 2013. “Working Together: Effective Partnerships Between Native CDFIs and Banks Bridge the Financing Gap in Indian Country.” Community Developments Investments. U.S. Department of the Treasury.
Insight Center for Community Economic Development. 2009. The Racial Gap in Homeownership and Home Lending. http://www.insightcced.org/uploads/CRWG/Racial%20Gap%20in%20Homeownership%20Spring%202009.pdf.
Inter Tribal Council of Arizona, Inc. n.d. “Quechan Tribe: Introductory Information.” http://itcaonline.com/?page_id=1173.
James, Cara, Karyn Schwartz, and Julia Berndt. 2009. A Profile of American Indians and Alaska Natives and Their Health Coverage. The Henry J. Kaiser Family Foundation. http://kaiserfamilyfoundation.files.wordpress.com/2013/01/7977.pdf.
Kids Count Data Center. 2012. “Children Ages 3 to 4 Who Are Not Attending Preschool by Race” (data table). Annie E. Casey Foundation. http://goo.gl/shrB3l.
Lee, Valerie E., and David T. Burkam. 2002. Inequality at the Starting Gate: Social Background Differences in Achievement as Children Begin School. Washington, D.C.: Economic Policy Institute.
National Center for Health Statistics. 2013. “Table 11. Infant, Neonatal, and Postneonatal Mortality Rates, by Detailed Race and Hispanic Origin of Mother: United States, Selected Years 1983–2008.” Health, United States, 2012: With Special Feature on Emergency Care. U.S. Department of Health and Human Services.
National Congress of American Indians. 2013a. “Honoring the Trust Responsibility in the Federal Budget.” Tribal Leaders Briefing Book, November 2013. http://files.ncai.org/broadcasts/2013/November/ba%20-%20Budget.pdf.
National Congress of American Indians. 2013b. Securing Our Futures. http://www.ncai.org/Securing_Our_Futures_Final.pdf.
National Congress of American Indians Policy Research Center. 2012. “Higher Education and Workforce Development: Leveraging Tribal Investments to Advance Community Goals.” Tribal Insights Brief. http://www.ncai.org/resources/ncai_publications/tribal-insights-brief-higher-education-workforce-development-leveraging-tribal-investments-to-advance-community-goals.
National Congress of American Indians Policy Research Center. 2013. American Community Survey Data on the American Indian/Alaska Native Population: A Look Behind the Numbers (unpublished white paper).
National Dropout Prevention Center/Network. n.d. Effective Strategies for Dropout Prevention. http://www.dropoutprevention.org/effective-strategies.
National Native American Economic Policy Summit. 2007. National Native American Economic Policy: Developing Tribal Economies to Create Healthy, Sustainable, and Culturally Vibrant Communities. http://www.ncai.org/resources/ncai-publications/native-american-economic-policy-report.pdf.
Pager, Devah, Bruce Western, and Bart Bonikowski. 2009. “Discrimination in a Low-Wage Labor market: A Field Experiment.” American Sociological Review, vol. 74, 777–799.
Ruggles, Steven J., Trent Alexander, Katie Genadek, Ronald Goeken, Matthew B. Schroeder, and Matthew Sobek. 2013. Integrated Public Use Microdata Series: Version 5.0 [machine-readable database]. University of Minnesota.
Schmitt, John, and Dean Baker. 2006. Missing Inaction: Evidence of Undercounting of Non-Workers in the Current Population Survey. Center for Economic and Policy Research.
U.S. Census Bureau. 2013. “Selected Population Profile in the United States, 2011 American Community Survey 1-Year Estimates, Table S0201.” American Fact Finder. http://factfinder2.census.gov/faces/tableservices/jsf/pages/productview.xhtml.
U.S. Department of the Treasury. 2001. The Report of the Native American Lending Study: Community Development Financial Institutions Fund.
White House Office of the Press Secretary. 2013. “Remarks by the President on Economic Mobility.” December 4. http://www.whitehouse.gov/the-press-office/2013/12/04/remarks-president-economic-mobility.
