Briefing Paper #336
The motor-vehicle manufacturing sector is the second-largest employer among all U.S. manufacturing industries, and auto parts and tires contribute the most direct jobs (nearly two-thirds or more) to the motor-vehicle sector.1 Throughout all 50 states, there are 1.6 million jobs directly or indirectly supported by auto-parts and tire manufacturing (the “auto-parts industry”).
Although U.S. automakers have enjoyed a strong turnaround since the government helped restructure General Motors and Chrysler in 2009—with sales up 29.1 percent—that has not translated into a turnaround for the U.S. auto-parts industry, as indicated by the best-available measure of concern to American workers: jobs.2 Since the deepest point of the recession in 2009, the U.S. auto-parts industry has regained only 60,000 jobs, an increase of 13.8 percent (Bureau of Labor Statistics 2011). This gain is nowhere near what is needed to erase years of losses: The United States lost more than 400,000 direct jobs in auto parts between November 2000 and November 2011.
Auto sales since the depths of the recession have increased more than twice as fast as employment in auto parts in part because of the rapid growth in auto parts imported from China—the fastest-growing source of U.S. auto-parts imports.
Chinese auto-parts exports increased more than 900 percent from 2000 to 2010, largely because the Chinese central and local governments heavily subsidize the country’s auto-parts industry; they provided $27.5 billion in subsidies between 2001 and 2010 (Haley 2012). Many of these subsidies are prohibited by the World trade Organization (Stewart, et al.2012). Furthermore, makers of auto parts in China benefit from China’s illegal currency manipulation, which reduces the cost of Chinese auto parts by an additional 25 to 30 percent (Scott 2011b, 2–3). Other Asian countries, such as Japan and South Korea, also manipulate their currencies and have used other unfair trade policies to illegally promote sales of auto parts. In addition, Japan is one of the most closed markets in the world to auto parts from the United States due to the influence of its Kieretsu groups of auto suppliers, interlocking networks of suppliers affiliated with each of the major Japanese auto assemblers.
Such unfair trade policies and actions pose a threat to future employment in the U.S. auto-parts industry (and indeed the overall motor-vehicle sector). While it is obviously unlikely that this entire industry will disappear, it is fair to say that every one of the United States’ auto-parts jobs is individually at risk from China’s unfair trade practices.
It doesn’t have to be this way. While the United States and its North American Free Trade Agreement partners Canada and Mexico have trade deficits with China in auto parts, Japan, Germany, and South Korea—countries that actively manage trade in autos and parts—have had trade surpluses with China in auto parts in every year since 2005. In contrast to the NAFTA countries, automakers from Japan, Germany, and South Korea have continued to rely on and nurture suppliers of auto parts from their own home markets. The United States needs to learn from and emulate countries such as Germany that have effective and legal trade and industrial policies.
This report documents the magnitude of employment in the U.S. auto-parts industry (encompassing auto parts and tires) to show the potential broad impact of unfair trade competition and the failure of the United States to operate effective trade policies.
In particular, we find:
- Despite recent growth, the U.S. motor-vehicle sector is still behind. Total U.S. motor-vehicle sector sales in 2011 were 48.1 percent below sales in 2000 because of declining overall demand and significant long-term loss of market share.
- The U.S. auto-parts industry is particularly vulnerable. The U.S. trade deficit in auto parts increased from $9.5 billion in 2000 to $31.2 billion in 2010. Exports support U.S. jobs, but imports displace production that would support domestic employment; thus, on balance, trade deficits tend to increase unemployment (holding everything else in the economy constant).
- The U.S. auto-parts industry is threatened by Chinese practices. Heavily subsidized auto parts from China caused the U.S. auto-parts trade deficit with that country to increase more, in total, than the U.S. auto-parts trade deficit with any other country. In 2010, the U.S. auto-parts trade deficit with China reached $9.1 billion—almost a third (29.3 percent) of the total U.S. auto-parts trade deficit.
- The rapid growth of imports of subsidized and unfairly traded auto parts from China puts at risk every job both directly and indirectly supported by the U.S. auto-parts industry.{{ }}In 2010, U.S. imports of tires and auto parts from China exceeded exports of those products to the country by 725 percent.
- Potential job losses in the states are significant. The 10 most vulnerable states (as measured by total auto-parts industry employment as of 2009) are Michigan (249,989 jobs), Ohio (189,039 jobs), Indiana (132,769 jobs), Illinois (98,748 jobs), Tennessee (79,225 jobs), Texas (74,942 jobs), California (70,883 jobs), Kentucky (58,745 jobs), New York (58,429 jobs), and North Carolina (54,540 jobs).
- For some states, auto-parts jobs are a significant share of overall employment. The 10 most vulnerable states as measured by auto-parts employment as a share of total state employment in 2009 are Michigan (6.5 percent of total state employment), Indiana (4.8 percent), Ohio (3.7 percent), Kentucky (3.3 percent), Tennessee (3.0 percent), Alabama (2.2 percent), South Carolina (1.9 percent), Illinois (1.7 percent), Wisconsin (1.6 percent), and North Carolina (1.4 percent).
The decline of the U.S. motor-vehicle sector and auto-parts industry, 2000–2011
The market for U.S.-made vehicles has been hollowed out by globalization, rapidly growing import competition, and by the post-2007 collapse in the U.S. economy, which had severe impacts on demand for autos and other consumer durables. Total domestic car and truck sales of U.S. automakers fell from 11.5 million units in 2000 to 4.6 million units in 2009, at the depths of the industry crisis—a decline of 60 percent (Ward’s Automotive Group 2012).
Total sales of motor vehicles in the United States (composed of domestically made vehicles and imports) were stable, averaging above 16 million units per year between 1994 and 2008; during the recent recession, however, sales dropped precipitously. Even with the recovery of the last two years, and total sales of 12.7 million units in 2011, the U.S. light-vehicle market (the vast majority of all domestic and imported motor vehicles sold in the United States) in 2011 was about 22.4 percent smaller than the average annual market of the 15 years that preceded the crisis (Ward’s Automotive Group 2012).3
Although overall car and truck sales were stable between 1994 and 2008, U.S. automakers suffered from a steadily declining market share beginning in 1990, a trend that only accelerated after 2007, with U.S. auto sales and market share reaching their nadir in 2009. However, U.S. auto producers’ sales have increased sharply since the restructuring of GM and Chrysler in 2009. The combined market share of U.S. automakers increased 3.3 percentage points between 2009 and 2011, and their 2011 unit sales of light vehicles increased 29.1 percent over sales in 2009 (Ward’s Automotive Group 2012).
While total U.S. automaker sales in 2011 reached nearly six million units, they were 48.1 percent below levels achieved in 2000, a product of both declining overall demand and significant long-term loss of market share by the U.S.-based producers.
Employment in the U.S. auto-parts industry
The bulk of employment in the U.S. auto-parts industry is driven by demand for original equipment manufacturer (OEM) parts to supply auto assembly plants in the United States. Since the auto-parts industry follows the trends of the overall motor-vehicle sector (Office of Transportation and Machinery 2011, 9), direct employment in the U.S. auto-parts industry has fallen significantly in recent years, declining by 419,600 jobs (45.8 percent) from November 2000 to November 2011 (Figure A).
Direct employment in the U.S. auto-parts industry (selected months, November 2000–November 2011)
NOTE: Figures are rounded to the nearest thousand, and refer to jobs directly supported by auto-parts production. SOURCE: EPI analysis of data from the Bureau of Labor Statistics (2011) |
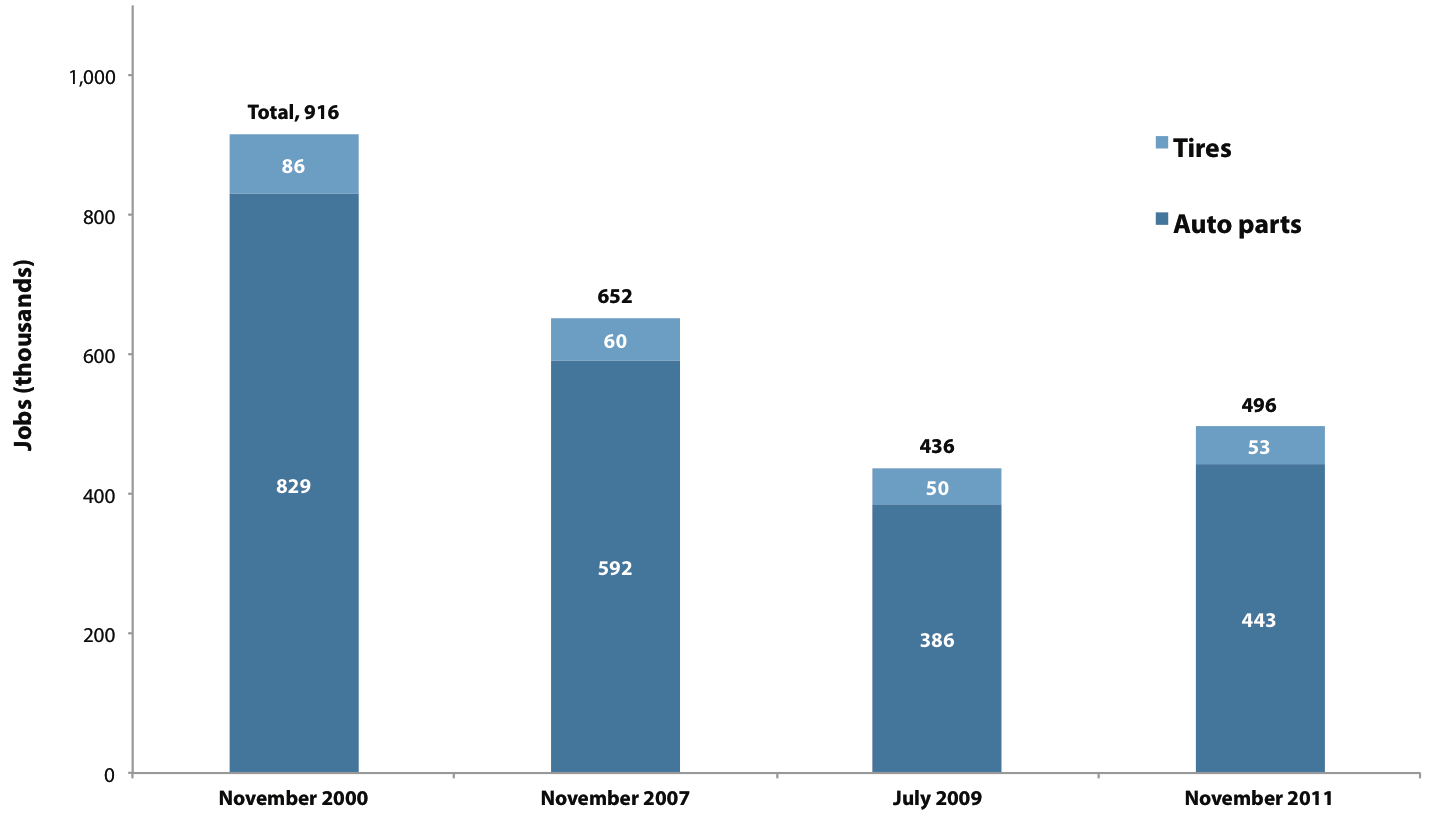
A total of 496,000 workers were directly employed in the U.S. auto-parts industry in November 2011,4 compared with 915,600 workers in November 2000 and 651,600 in November 2007, on the eve of the recession. Direct employment fell to a low of 436,000 in July 2009, when the restructuring of GM and Chrysler dramatically lowered demand for parts. The industry lost a total of 479,600 direct jobs between November 2000 and July 2009, a decline of 52.4 percent, as shown in Figure A. Between the trough in mid-2009 and November 2011, 60,000 jobs were recovered, an increase of 13.8 percent. However, total employment in the auto-parts industry remained 155,600 jobs (23.9 percent) below the pre-recession level in 2007.
The recent recovery of vehicle sales relative to the recession’s trough thus stands in stark contrast to employment in the auto-parts industry, with sales of U.S.-based automakers having increased more than twice as fast as U.S. direct auto-parts employment from 2009 to today. The difference is explained, in part, by the rapid growth in imports of unfairly traded auto parts from China.
Growing direct threats to employment in the U.S. auto-parts industry
Trade deficits in both assembled autos and auto parts are a major contributor to job losses in both the motor-vehicle sector and the auto-parts industry. The U.S. motor-vehicle sector has sustained a large global trade deficit (now $106.7 billion) over the last decade,5 and auto parts’ share of that total deficit has risen steadily, from 8.4 percent in 2000 to a historic high of 29.2 percent in 2010, as shown in Figure B (measured on the left axis).
U.S. trade deficit in auto parts in billions of dollars, and as a share of total motor-vehicle trade deficit, 2000–2010
SOURCE: EPI analysis of data from the United Nations Commodity Trade Statistics Database (United Nations 2012) |
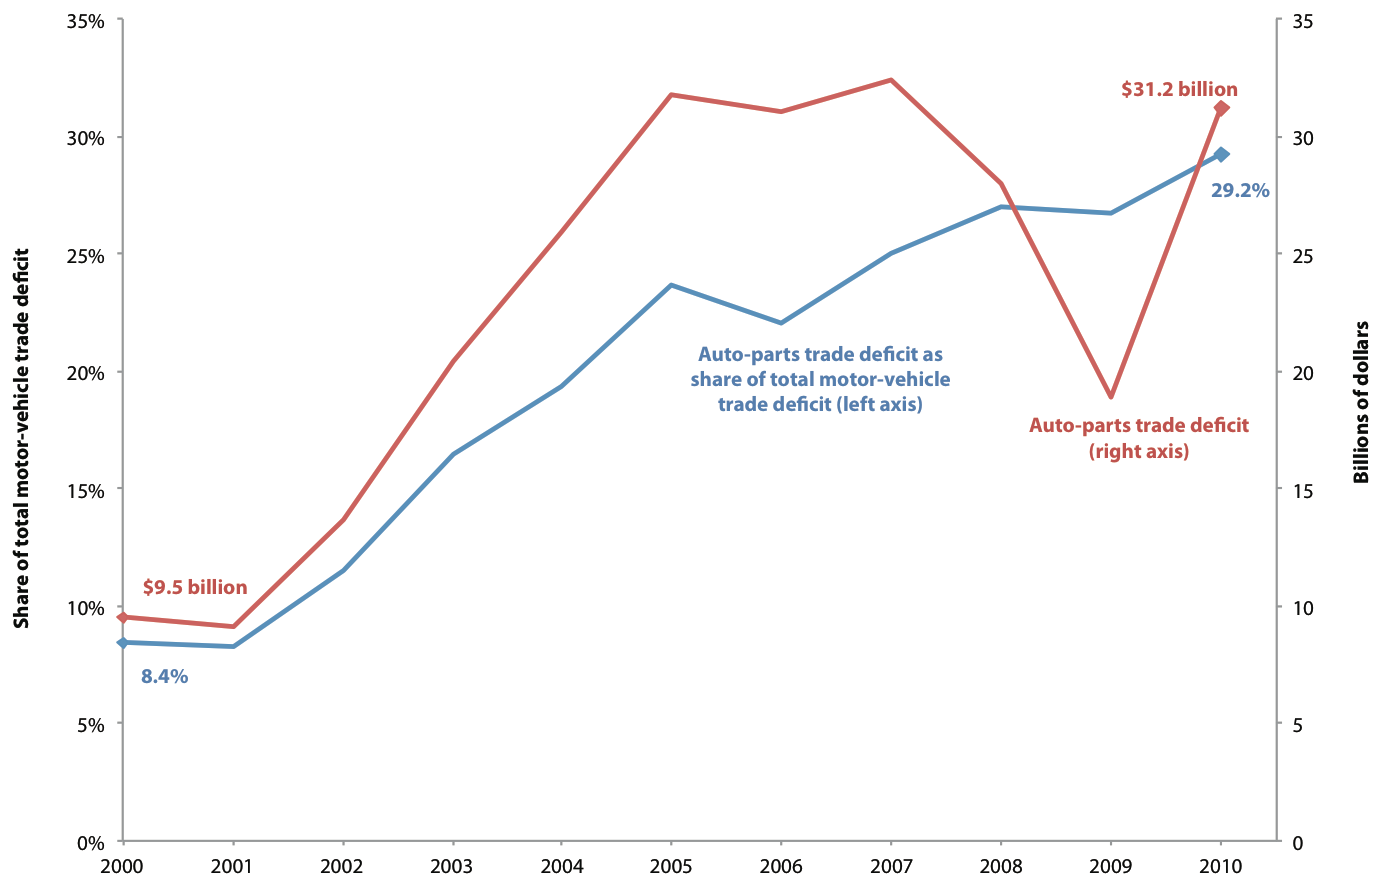
In dollar terms, the United States exported about $58 billion worth of auto parts in 2010, but imported $89 billion, resulting in a $31.2 billion trade deficit, which includes both OEM and replacement parts (United Nations 2012). This is an increase from a deficit of $9.5 billion in 2000, as demonstrated in Figure B (measured on the right axis).
(The products included in U.S. auto-parts trade in this report are broadly defined to include tires, electrical and electronic equipment, engines, and other auto parts as defined in the Methodology section of this paper. They are based on a list of products by Harmonized Tariff Schedule [HTS] codes that are shown in the Appendices. This list was adapted from the U.S. Department of Commerce [Office of Transportation and Machinery 2011, Appendix 1].)
Several factors explain the rapid growth of the auto-parts trade deficit. First, as U.S. automakers’ share of the U.S. vehicle market fell over the past decade, so did the demand for domestic parts, because U.S.-made cars historically have had a larger share of domestically manufactured parts than is the case with foreign-made autos.
Second, the number of foreign-owned vehicle assembly plants in the United States has grown. Production in these plants increased from 2.6 million light vehicles in 1999 to more than four million light vehicles in 2007 (24.3 percent of total U.S. light vehicle sales). While foreign-owned vehicle assembly plants produced 3.4 million light vehicles in 2010, their share of total U.S. light vehicle sales had increased to 28.9 percent (Office of Transportation and Machinery 2011, 11; Ward’s Automotive Group 2012). These transplant facilities use a higher share of imported auto parts in their production, so as they gain production share in the United States, auto-parts trade deficits tend to rise. This has deleterious effects on U.S. employment. In its U.S. Automotive Parts Industry Annual Assessment, the U.S. Department of Commerce notes that over the past 14 years, the number of workers in foreign-owned transplant facilities relative to U.S.-owned facilities has steadily increased—and with each new employee added to foreign-owned transplant facilities, U.S. companies lay off 6.1 employees (Office of Transportation and Machinery 2011, 16).
A third factor contributing to the U.S. auto-parts trade deficit is that foreign-affiliated auto-parts suppliers have made significant inroads into the U.S. supplier market through acquisitions, sales to transplant automakers, and sales to U.S. automakers (Office of Transportation and Machinery 2011, 11).6 For example, more Japanese and Korean vehicle assembly plants are operating in the United States and they are buying parts from their parts affiliates located in the United States.7 (In this regard, trends in the auto-parts industry reflect an overall trend of rising U.S. trade deficits due to the dependence of U.S. affiliates of foreign multinationals in all industries on imported inputs.8)
As a result of these and other trends, the United States has a rapidly growing trade deficit in auto parts. While exports of auto parts support domestic jobs, imports displace them. On balance, large and growing trade deficits in autos and auto parts are responsible for a substantial share of the auto-parts jobs lost in the past decade (Scott 2011a, 8).
Figure C provides a breakdown of the U.S. auto-parts trade deficit with selected countries between 2000 and 2010. The countries responsible for the vast bulk of the U.S. trade deficit in auto parts in 2010 were:
- Japan ($12.3 billion, accounting for a 39.7 percent share of the total U.S. auto-parts trade deficit)
- Mexico ($9.5 billion, 30.3 percent)
- China ($9.1 billion, 29.3 percent)
- Germany ($5.3 billion, 16.9 percent)
- South Korea ($4.5 billion, 14.5 percent)
The United States had a surplus in auto-parts trade with Canada of $9.3 billion in 2010; however, it also had a trade deficit in finished autos with Canada, and an overall deficit in vehicle and parts trade with that country (United Nations 2012).
U.S. trade deficit in auto parts with selected countries, 2000–10
SOURCE: EPI analysis of data from the United Nations Commodity Trade Statistics Database (United Nations 2012) |
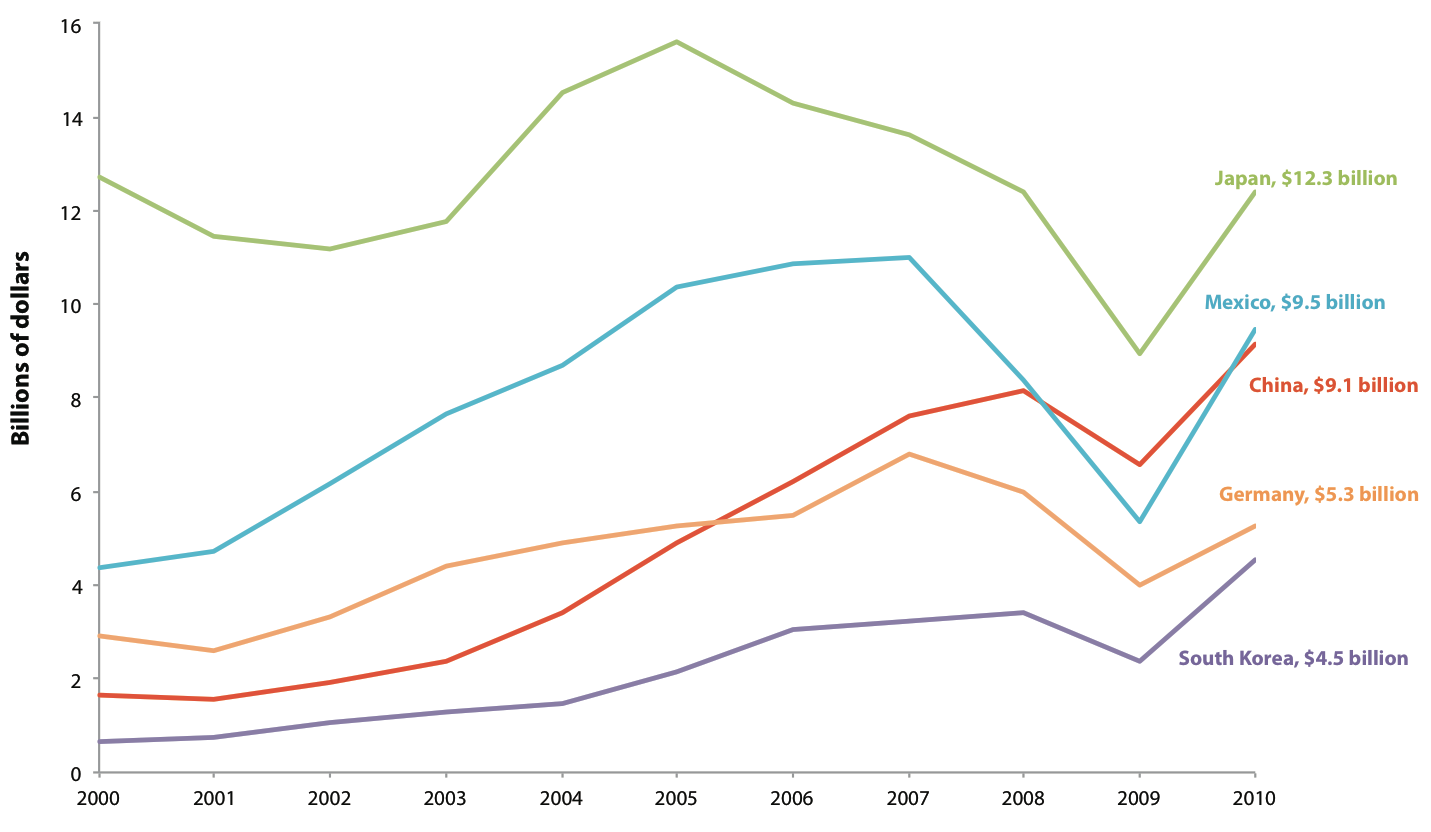
However, the most notable trend is that heavily subsidized auto parts from China caused the U.S. auto-parts trade deficit with that country to increase more, in total, than any other bilateral deficit, as shown in Figure C.9 The growth of this deficit took a particularly heavy toll on employment in the U.S. auto-parts industry.
Threats posed by imports of unfairly traded Chinese auto parts
U.S. imports of auto parts from China and South Korea have grown more over the past three years than auto-parts imports from any other country. While trade deficits with all countries fell in 2009, a more appropriate comparison is to examine changes in trade since the year leading up to the recession, 2007.10 Between the last business cycle peak in 2007 and 2010, the shares of the U.S. auto-parts trade deficit accounted for by China and South Korea rose rapidly, while those of other major producers declined:
- China’s share gained 5.8 percentage points
- South Korea’s share gained 4.5 percentage points
- Japan’s share declined 2.2 percentage points
- Mexico’s share declined 3.5 percentage points
- Germany’s share declined 4.1 percentage points11
Exporters from China and South Korea took advantage of the recession to gain market share in the U.S. auto-parts market and to push aside producers from other exporting nations. In China’s case, they were aided by $27.5 billion in subsidies to the auto-parts industry through subsidized coal, electricity, natural gas, glass, and steel between 2001 and 2010 (Haley 2012), as well as by China’s illegal currency manipulation—which reduces the cost of Chinese auto parts by an additional 25–30 percent (Scott 2011b, 2-3).
Many of the subsidies China has provided to its auto and auto-parts industries violate its obligations to the WTO (Stewart et al. 2012). In addition, China has imposed performance requirements on foreign investors, requiring them to transfer technology to local joint-venture partners; discriminated against imported goods; and imposed restrictions on the exports of rare-earth minerals and other critical raw materials—giving an unfair advantage to its domestic auto-parts producers. Each of these policies appears to violate China’s WTO commitments (Stewart et al. 2012).
The rapid growth of China’s subsidized auto-parts exports has reinforced the global sourcing strategies of U.S. automakers. Klier and Rubenstein (2009, 4) examined trends in U.S. auto-parts imports by country between 1996 and 2008, and grouped auto parts according to whether they came from high- or low-wage countries. Low-wage countries gained 25 percentage points in their share of total U.S. auto-parts imports between 1996 and 2008, and they were effectively responsible for 69 percent of the growth in auto-parts imports in that period. Additionally, total auto-parts imports as a share of material costs in light-vehicle assembly increased from 29 percent to 36 percent between 1997 and 2002 alone. China’s share of total U.S. auto-parts imports increased more rapidly than that of any other country cited in their study, rising from about 1 percent in 1996 to more than 10 percent in 2008 (Klier and Rubenstein 2009, Figure 4).
It is important to recognize that simple measurement of the nominal dollar value of Chinese auto parts may underestimate their impact on U.S. auto-parts output and employment, as it can lead to a significant undercounting of the real value of imports (Houseman 2011). If auto parts from China displace domestic goods (or even auto parts from higher-cost trading partners such as Canada or Germany) that have a much higher unit value, then trade flows will underestimate the impact of Chinese imports on the domestic auto industry. If, for example, tires or brake shoes from China cost 50 percent less than equivalent domestic products, then $100 worth of imports would displace $200 worth of domestic output and the labor required to produce $200 of domestically made goods.
China’s growing importance in the global auto-parts industry
Fueled by extensive subsidies, Chinese production and exports of auto parts have increased dramatically over the past decade (Haley 2011, Figure B). Indeed, China’s exports of auto parts increased more than tenfold between 2000 and 2010, rising from $3.9 billion in 2000 to $41.2 billion in 2010, as shown in Figure D (United Nations 2012). In 2009, China became the fourth-largest exporter of auto parts in the world after Germany, the United States, and Japan (Office of Transportation and Machinery 2011, Table 9). China’s imports of auto parts have also increased precipitously over the past decade due to the rapid growth of auto production and consumption in China.12 China’s auto-parts imports rose from $3.8 billion in 2000 to $32.1 billion in 2010 (United Nations 2012), also shown in Figure D. Because China’s auto-parts exports grew faster than imports, it developed a global trade surplus in auto parts in 2005—a surplus that exceeded $9.0 billion in 2010.
China’s auto-parts trade, 2000–2010
SOURCE: EPI analysis of data from the United Nations Commodity Trade Statistics Database (United Nations 2012) |
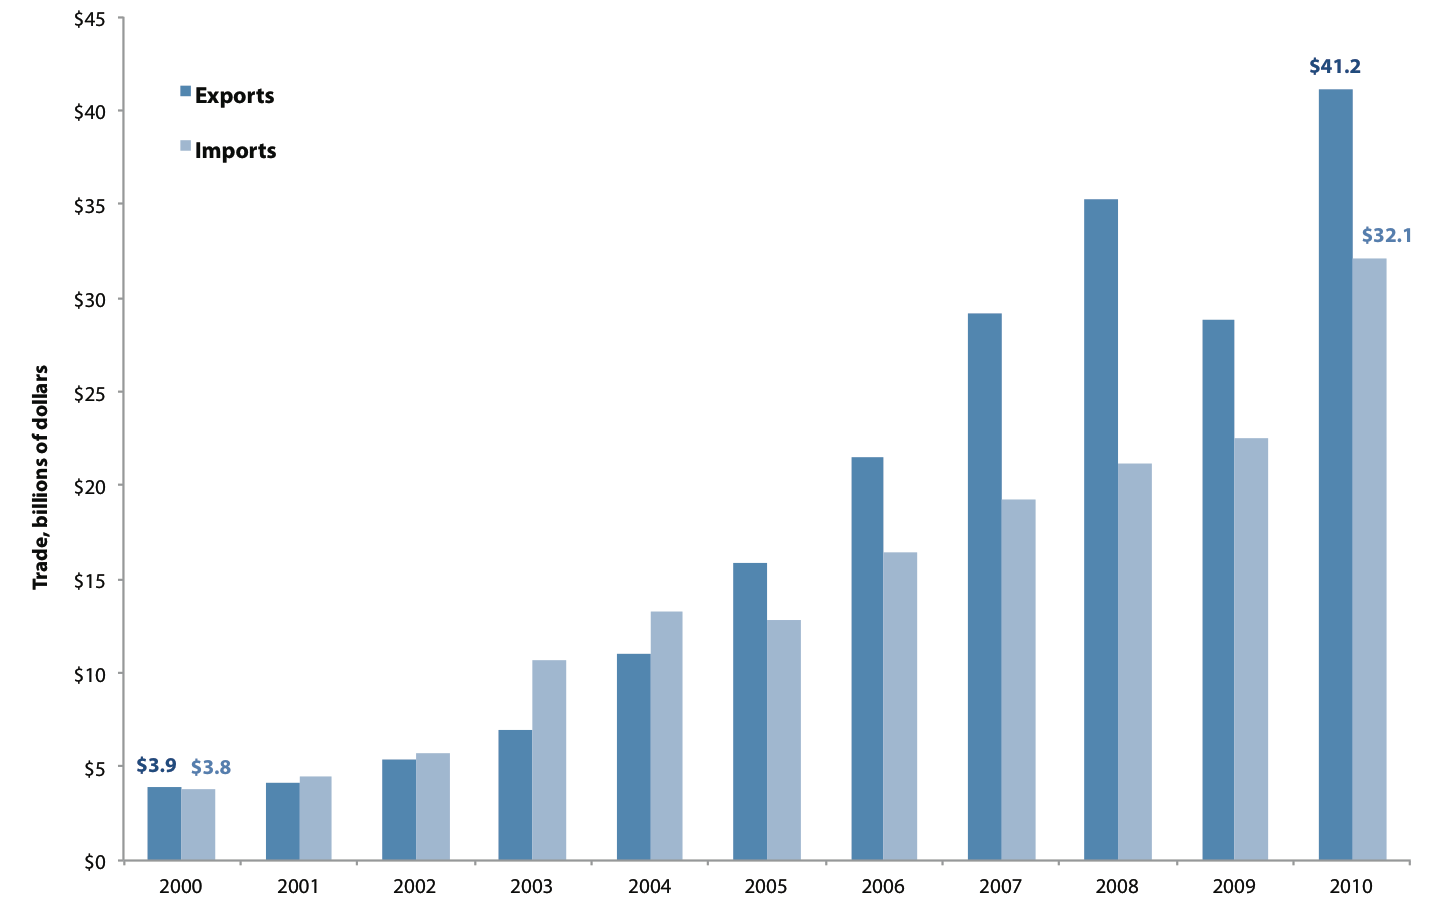
However, exports of tires alone accounted for the vast bulk of China’s auto-parts trade surplus (see the Methodology section of this paper). Excluding tires, China had a global trade deficit in auto parts in seven of the past 10 years, including a deficit of $100 million in 2010. Thus, except for trade in tires, the rest of the world had a substantial trade surplus in auto parts with China for most of the past decade. However, during this same period, China has maintained large and growing trade surpluses in auto parts (with and without tires) with the United States. In 2010, U.S. imports of auto parts (including tires) from China exceeded exports of those products to the country by 725 percent (United Nations 2012).
Contrasting outcomes from managed trade in auto parts
Due to its rapid increase in auto-parts exports, China has grown to play a major role as a supplier of parts for vehicles assembled in the United States, Mexico, and Canada. However, there is a sharp contrast between China’s auto-parts trade relationship with the United States, Mexico, and Canada on the one hand—and its relationships with other major trading partners in Asia and Europe on the other. This is illustrated in Figure E, which provides a snapshot of China’s auto-parts trade with major countries in 2010. In that year, China had a sizeable trade surplus of $8.8 billion with the United States, and smaller surpluses with Mexico and Canada.13 These North American countries all practice relatively open trade, and each is a party to the North American Free Trade Agreement. The NAFTA countries base their approach to trade and industrial development on a “neoliberal,” or market-driven, model.
China’s auto-parts trade with selected countries, 2010
NOTE: For the reasons why China’s estimate of its auto-parts trade surplus with the United States differs from the bilateral U.S.-China auto-parts trade balance reported in Figure C, see note 13. SOURCE: EPI analysis of data from the United Nations Commodity Trade Statistics Database (United Nations 2012) |
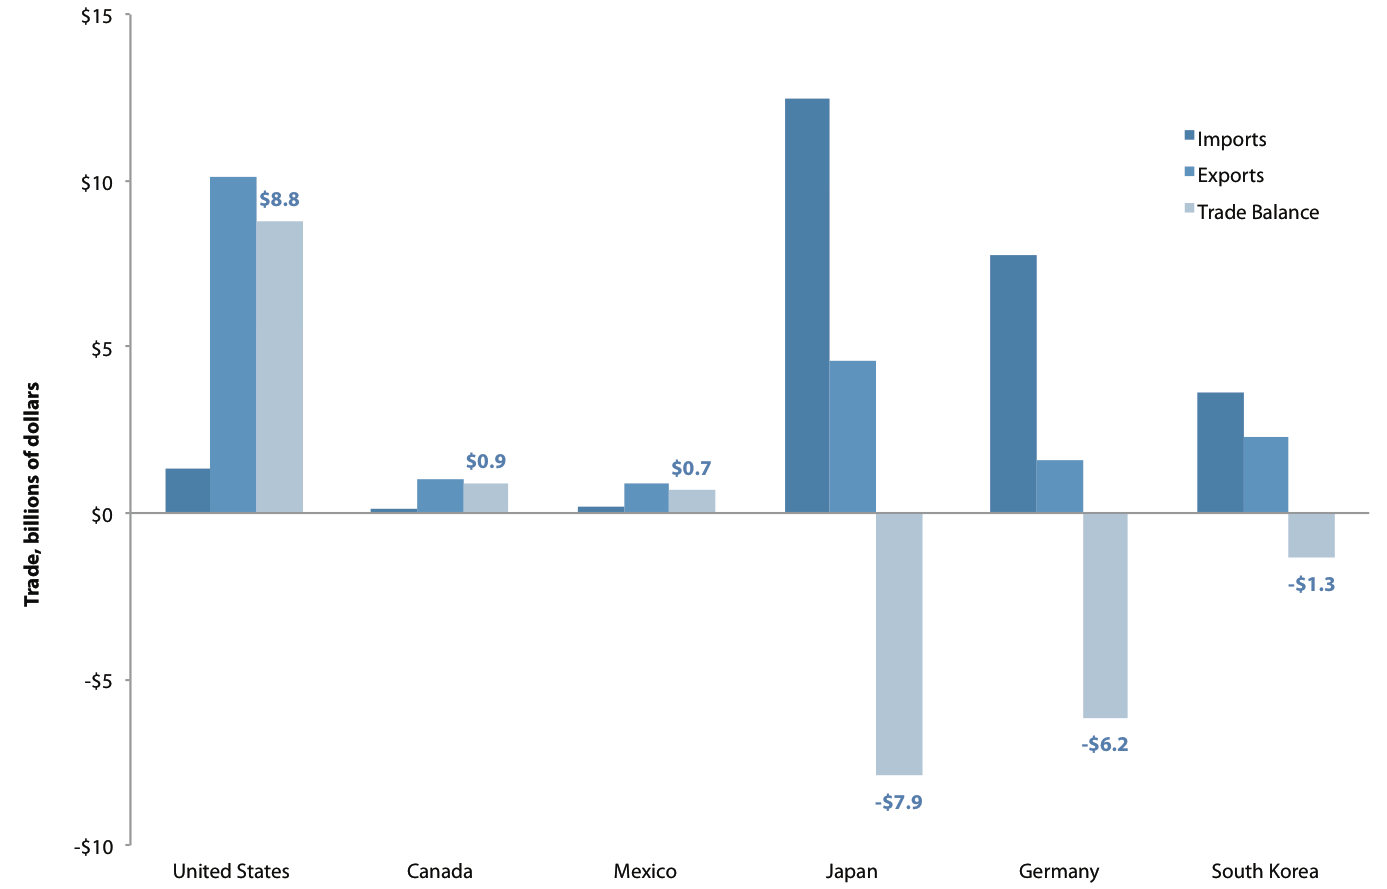
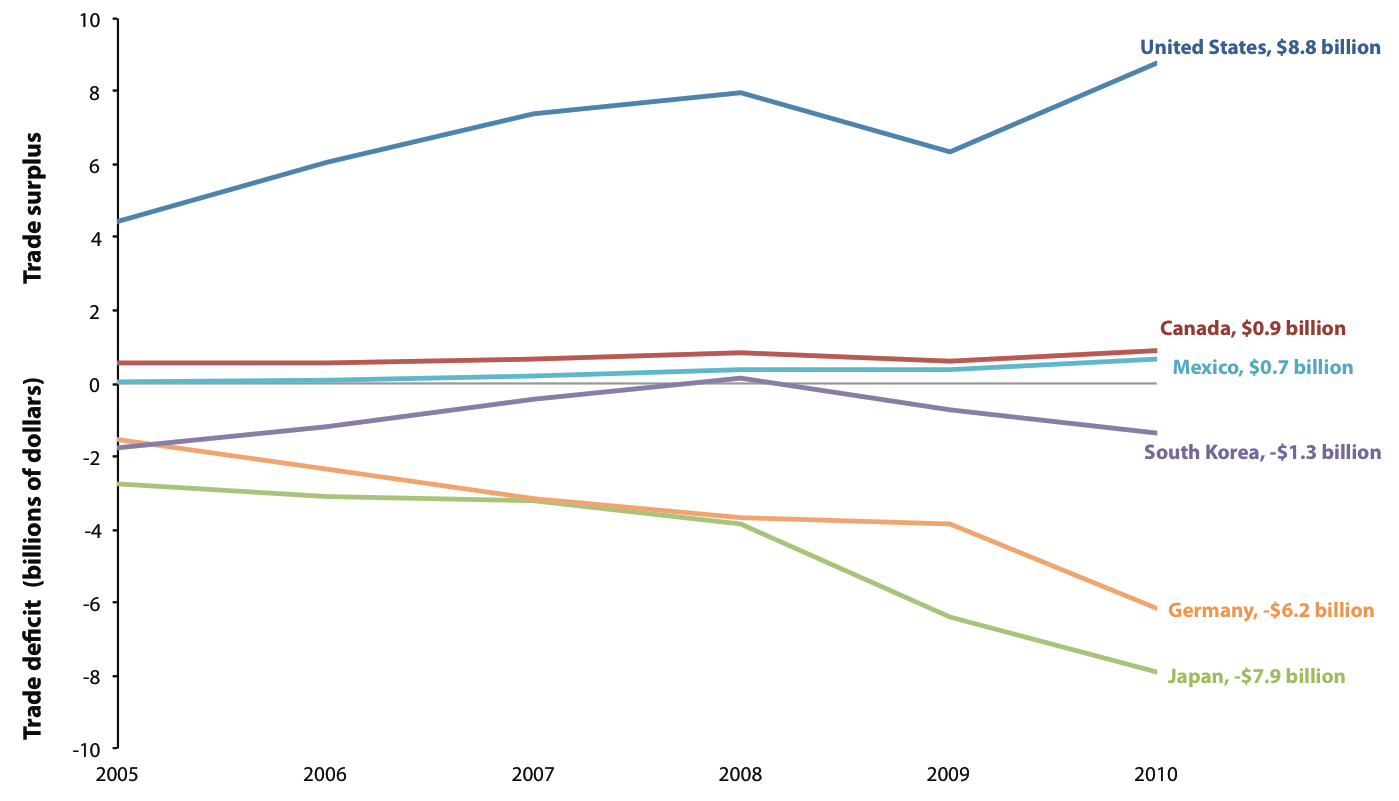
China, however, does not demand the same type of performance from its trade with Asian and European countries, many of which have employed managed-trade approaches and active industrial policies. In 2010, China had auto-parts trade deficits with Japan ($7.9 billion), Germany ($6.2 billion), and South Korea ($1.3 billion), as shown in Figure E. Auto-parts deficits between China and its managed-trade partners have persisted since at least 2005, as shown in Figure F.14 In particular, Japan and Germany have maintained substantial trade surpluses with China throughout this period. South Korea has also sustained trade surpluses, with the exception of a brief downturn in 2008.
China’s trade balance in auto parts with selected countries, 2005–10
NOTE: For the reasons why China’s estimate of its auto-parts trade surplus with the United States differs from the bilateral U.S.-China auto- parts trade balance reported in Figure C, see note 13. SOURCE: EPI analysis of data from the United Nations Commodity Trade Statistics Database (United Nations 2012) |
Auto suppliers from managed-trade countries—particularly Germany, Japan, and South Korea—place a high priority on maintaining employment in their domestic motor-vehicle sector, in part as a reflection of stakeholder relationships and of differences in the institutional governing structures of their private manufacturing corporations. Employment is supported, in part, through maintaining a positive balance of trade with both China and the United States. These countries’ firms maintain cost competitiveness by placing a premium on innovation and product quality, and have for many years. In addition, auto-parts suppliers from Japan and South Korea have benefited from their countries’ policy of managing the value of their currency to protect their own export competitiveness, and of also actively discriminating against auto-parts imports—something that the United States does not and should not do. The United States should, however, confront currency manipulation and illegal trade barriers wherever they occur, especially in auto parts, because of the large number of jobs at risk.
German firms provide an alternative, positive example of supporting domestic manufacturers. German automakers have prospered despite paying high wages and providing excellent benefits to their workers. German manufacturers practice “stakeholder capitalism” in which boards of directors include an equal number of representatives of managers and workers (Meyerson 2011). Germany also has an entire sector of banks devoted to financing small- and medium-sized firms, which reduces such firms’ need to rely on private capital markets and lessens the demand for maintaining short-term profits. Additionally, Germany has a highly developed school-to-work job training system for non-college-educated workers that is much more effective than U.S. job training and displaced-labor-assistance programs. As a result, over the past decade Germany has maintained a large and growing trade surplus even relative to low-wage countries outside the eurozone. Furthermore, it has maintained its competitiveness in world export markets, and its exports are dominated by autos and other high-value, durable manufactured goods.
As a product of a managed-trade approach, the European auto industry as a whole actually experienced net employment growth during the past decade, despite the rapid growth of China’s auto-parts exports and of auto exports from Japan and Korea. Europe’s total direct employment in the overall motor-vehicle sector rose from 2,282,000 in 2001 to 2,294,000 in 2007, an increase of 0.5 percent (European Automobile Manufacturers’ Association 2011).
This contrasts sharply with the U.S. experience in this period. Between 2001 and 2007, the United States lost 241,300 jobs (a decline of 18.6 percent) in the overall motor-vehicle sector, including auto assembly, bodies and trailers, auto parts, and tires (Bureau of Labor Statistics 2011). Job losses in auto parts and tire production were responsible for the vast majority of U.S. job displacement in the motor-vehicle sector in this period; 189,600 jobs were lost, a decline of 22.1 percent.15
These diverging outcomes suggest that the United States should learn from and emulate the successful trade and industrial policies developed by Germany and other successful Northern European democracies. The advantages enjoyed by managed-trade countries are particularly apparent when contrasting U.S. auto-parts trade with managed-trade countries, with U.S. auto-parts trade with its NAFTA partners. For example, U.S. auto-parts imports from China exceeded exports to that country by 725 percent in 2010 (United Nations 2012). With Germany that ratio exceeded 400 percent; South Korea, more than 970 percent; and Japan—one of the most closed markets in the world—more than 1,000 percent. In contrast, U.S. auto-parts imports from Mexico exceeded U.S. bilateral exports by only 46 percent. At the same time, the United States had a trade surplus in auto parts with Canada, with exports that were nearly twice as large as imports (despite the fact that the United States had an overall trade deficit in vehicles and parts with Canada in 2010).
Job-loss risks for every state
In 2009, 1,584,503 jobs were supported directly or indirectly by the auto-parts industry (formally known as the motor-vehicle parts and tire industries), report Hill, Menk, and Cooper (2010). The rapid growth of imports from China puts these jobs at risk. Tables 1, 2, and 3 list the total number of jobs directly and indirectly supported by the U.S. auto-parts industry in each state. Table 1 ranks the states by the total number of jobs supported by the industry; Table 2 ranks states by the share of total state employment accounted for by the industry; and Table 3 lists the states alphabetically and provides the total number of auto-parts jobs in each state.
As shown in Table 1, the 10 most vulnerable states (as measured by total auto-parts industry employment in 2009) are Michigan (249,989 jobs), Ohio (189,039 jobs), Indiana (132,769 jobs), Illinois (98,748 jobs), Tennessee (79,225 jobs), Texas (74,942 jobs), California (70,883 jobs), Kentucky (58,745 jobs), New York (58,429 jobs), and North Carolina (54,540 jobs).
Table 2 shows that the 10 most at-risk states, as measured by auto-parts employment as a share of total state employment in 2009, are Michigan (6.5 percent of total state employment), Indiana (4.8 percent), Ohio (3.7 percent), Kentucky (3.3 percent), Tennessee (3.0 percent), Alabama (2.2 percent), South Carolina (1.9 percent), Illinois (1.7 percent), Wisconsin (1.6 percent), and North Carolina (1.4 percent).
The jobs reported in the tables include both jobs directly supported by the auto-parts industry, and jobs indirectly supported by the industry (for example, jobs that it supports in related industries such as steel, aluminum, plastics, electronics, accounting, engineering, and other manufacturing, service, and commodity-providing industries). These estimates do not include re-spending or “expenditure-induced” jobs, which vary with the condition of the economy and the business cycle.
Conclusion
U.S. auto-parts suppliers have not benefited proportionately from the increase in U.S. automakers’ sales since 2009. The reasons include increased sourcing of auto-parts production to China, Mexico, and South Korea (Figure C), combined with a rapidly growing trade deficit in auto parts (Figure B), as well as rapid growth in the share of U.S. vehicles (both imported and U.S.-assembled) that have very low levels of domestically produced content.
The U.S. auto-parts trade deficit with the world has increased 65.4 percent between 2009 and 2010, reaching $31.2 billion. The U.S. auto-parts trade deficit with China reached $9.1 billion in 2010 (accounting for 29.3 percent of the total U.S. auto-parts trade deficit, Figure C). China’s share of the U.S. auto-parts trade deficit has increased faster than any other country’s share since 2007 (an increase of 5.8 percentage points in three years). U.S. auto parts makers are thus directly threated by rapidly growing imports of auto-parts from China, which benefited from $27.5 billion in subsidies between 2001 and 2010. Chinese auto-parts makers also benefit from China’s illegal currency manipulation, which reduces the cost of Chinese auto parts by an additional 25 to 30 percent.
As a result, all 1.6 million jobs in the U.S. auto-parts and supplier industries are at risk due to rapidly growing imports of auto parts.
Furthermore, there is a sharp contrast between the impacts of China’s practices on the auto-parts industry in the United States, and how they affect the auto-parts industries in countries that manage their trade, such as Germany, Japan, and South Korea. These countries emphasize balanced growth designed to maximize employment, output, and innovation at home—and they are not falling prey to the same job losses in the auto-parts industry as the United States, which lost 419,600 auto-parts jobs between November 2000 and November 2011. In short, these other countries face the same unfair trade practices emanating from China but appear to be doing a much better job of dealing with them. Some countries, such as Japan and South Korea, have responded with unfair trade policies that should be confronted by the United States. Germany, on the other hand, has successfully used industrial and labor market policies to better manage its trade with China and the world, which suggests that the United States has significant room for improvement in the development of more-effective policies to support the manufacturing sector. The most important first steps are to fight unfair currency manipulation (Scott 2011b) and illegal subsidies and other unfair trade barriers erected by China and other countries.
— The authors thank Mark Anderson, Josh Bivens, Christopher Traci, and Mike Wessel for helpful comments.
— EPI is grateful to the Alliance for American Manufacturing for support of our research and publication programs.
Methodology
To determine the United States’ and China’s international trade flows, we used the United Nations Commodity Trade Statistics Database (2012). We used the Harmonized Tariff Schedule codes (HTS) in our analysis of auto-parts and motor-vehicle trade flows. Our definition of the auto-parts industry for international trade purposes is composed of electrical and electronic equipment, parts, engines, tires, belts, seats, clocks for vehicles, and speed indicators. To ensure we are strictly measuring these codes for motor vehicles, we mostly use detailed, six-digit HTS codes, with the exception of five four-digit HTS codes, four of which are strictly for motor vehicles and the fifth being “Instrument panel clocks for vehicles, aircraft, etc.” Thus, this particular category might be slightly overstated. All trade data reported in Figures B through F are in nominal (not price- or inflation-adjusted) dollars. The full list of HTS codes that make up the auto-parts industry are in Appendix A.
Also notable is the inclusion of tires in our analysis. These are the largest subset of auto parts for China’s trade with every country; currently, China’s exports of tires makes up 23 percent of its total exports to the world. We include four six-digit codes for tires, which include tires for personal vehicles, buses, and new tires with and without Herring-bone tread.
Our definition for assembled motor vehicles—which are added to auto parts to derive overall motor-vehicle sector figures—is composed mainly of four-digit HTS codes with the exception of one six-digit code, which we used because we felt the parent four-digit code, “Special purpose motor vehicles,” was too broad. We include motor cars; vehicles used to transport people, such as station wagons; public transit vehicles; motor vehicles used to transport goods; and fire-fighting vehicles. The list of HTS codes for assembled motor vehicles is in Appendix B.
United Nations Commodity Trade Statistics Database (2012) data are further used to show United States trade in auto parts with other countries (Figures C, D, E, and F); specifically its North American counterparts, Mexico and Canada; its Asian competitors China, Japan, and South Korea; and its main European competitor, Germany. These countries are chosen because they have the highest volume of auto-parts trade with the United States and best demonstrate the relationships between the United States and the rest of the world in this sector. We use these countries to compare China’s trade in Figures E and F as well.
To calculate state-level employment, we use a tri-annual report by Hill, Menk, and Cooper (2010) from the Center for Automotive Research, which collects employment data for the auto-parts industry. The study reports data on both direct employment in the auto-parts industry (parts suppliers, motor-vehicle assemblers, and new vehicle dealership operations) and indirect employment, which includes jobs outside of auto parts that are a product of employment and production in the various auto-parts industries. Hill, Menk, and Cooper calculate direct employment using data from the Bureau of Economic Analysis, the Bureau of Labor Statistics (BLS), the U.S. Census Bureau’s County Business Patterns, the Rubber Manufacturers Association, and the Battery Council International using North American Industry Classification System (NAICS) four-, six-, and seven-digit codes (NAICS was developed by the U.S. Census Bureau). The specific subsector industries that, in addition to auto parts, manufacture parts exclusively for the auto-parts industry are tire manufacturing, motor-vehicle plastics and instruments, hose manufacturing, and motor-vehicle hardware such as locks, light bulbs, and batteries for motor vehicles (Hill, Menk, and Cooper 2010, 32–33). Indirect employment at the state level is employment that is a product from the direct employment industries listed above. It is calculated using an inter-industry model created by Regional Economic Models, Inc. (REMI). The REMI analysis considers demographic and industry-specific information for each region, and additionally trade flows, migration patterns, and commuter flows for each state.
To calculate national employment, we use the Bureau of Labor Statistics data for NAICS four- and five-digit industry codes for assembled vehicles, bodies and trailers, auto parts, and tires. While the BLS data are not as specific as Hill, Menk, and Cooper’s data, they are quite similar in that they also use NAICS 3363 (auto parts), which makes up roughly 76 percent of their definition of direct employment and also includes tires (NAICS 32621). This national time series data provide a telling snapshot of the trends in employment in the auto industry over the last decade, as shown in Figure A.
Appendix A. Harmonized Tariff Schedule (HTS) codes used to identify auto-parts industry for international trade flows
| HTS Code | Definition |
|---|---|
|
8511 |
Electrical ignition of starting equipment of a kind used for spark-ignition or compression-ignition internal combustion engines, e.g., ignition magnetos, magneto-dynamos, ignition coils, etc. |
|
8512 |
Electric lighting or signaling equipment (excluding lamps of heading 8539), windscreen wipers, defrosters and demisters, of a kind used for cycles or motor vehicles; parts thereof |
|
8706 |
Chassis fitted with engine for tractors, motor vehicles for the transport of ten or more persons, motor cars and other motor vehicles principally designed for the transport of persons, motor vehicles for the transport of goods and special purpose motor vehicles of heading 8701 to 8705 (excluding those with engines and cabs) |
|
8708 |
Parts and accessories for tractors, motor vehicles for the transport of 10 or more persons, motor cars and other motor vehicles principally designed for the transport of persons, motor vehicles for the transport of goods and special purpose motor vehicles of heading 8701 to 8705, n.e.s. |
|
9104 |
Instrument panel clocks etc. for vehicles, aircraft, vessels, and other vehicles |
|
401031 |
Endless transmission belts of trapezoidal cross-section ‘v-belts,’ of vulcanized rubber, v-ribbed, of an outside circumference > 60 cm but <= 180 cm |
|
401032 |
Endless transmission belts of trapezoidal cross-section ‘v-belts,’ of vulcanized rubber, of an outside circumference > 60 cm but <= 180 cm (excl. v-ribbed) |
|
401033 |
Endless transmission belts of trapezoidal cross-section ‘v-belts,’ of vulcanized rubber, v-ribbed, of an outside circumference > 180 cm but <= 240 cm |
|
401034 |
Endless transmission belts of trapezoidal cross-section ‘v-belts,’ of vulcanized rubber, of an outside circumference > 180 cm but <= 240 cm (excl. v-ribbed) |
|
401035 |
Endless synchronous belts, of vulcanized rubber, of an outside circumference > 60 cm but <= 150 cm |
|
401036 |
Endless synchronous belts, of vulcanized rubber, of an outside circumference > 150 cm but <= 198 cm |
|
401039 |
Transmission belts or belting, of vulcanized rubber (excluding endless transmission belts of trapezoidal cross-section ‘v-belts,’ v-ribbed, of an outside circumference > 60 cm but 60 cm but <= 198 cm) |
|
401110 |
Pneumatic tires new of rubber for motor cars, including station wagons and racing cars |
|
401120 |
Pneumatic tires new of rubber for busses or lorries (excluding tires with lug, corder or similar treads) |
|
401169 |
New pneumatic tires, of rubber, having a herring-bone/similar tread (exclusive of a kind used on agricultural or forestry and construction or industrial handling vehicles and machines, on motorcars, station wagons, racing cars, buses, lorries, aircraft, motorcycles, and bicycles) |
|
401199 |
|
|
401310 |
|
|
830120 |
Locks used for motor vehicles, of base metal |
|
840734 |
Spark ignition reciprocating piston engines of a kind used for the propulsion of vehicles of chapter 87, of a cylinder capacity of >1000cc |
|
840820 |
Compression-ignition internal combustion piston engine “diesel or semi-diesel engine,” for the propulsion of vehicles of chapter 87 |
|
840991 |
Parts suitable for use solely or principally with spark-ignition internal combustion piston engine, n.e.s. |
|
840999 |
Parts suitable for use solely or principally with compression-ignition internal combustion piston engine, n.e.s. |
|
841330 |
Fuel, lubricating or cooling medium pumps for internal combustion piston engine |
|
841520 |
Air conditioning machines of a kind used for persons, in motor vehicles |
|
848210 |
Ball bearings |
|
848220 |
Tapered roller bearings, incl. cone and tapered roller assemblies |
|
848240 |
Needle roller bearings |
|
848250 |
Cylindrical roller bearings (excluding needle roller bearings) |
|
848310 |
Transmission shafts, including cam shafts and crank shafts, and cranks |
|
850132 |
Dc motors and dc generators of an output > 750 w but <= 75 kw |
|
850710 |
Lead-acid accumulators of a kind used for starting piston engine “starter batteries” (excluding spent) |
|
850790 |
Plates, separators, and other parts of electric accumulators, n.e.s. |
|
852721 |
Radio-broadcast receivers not capable of operating without an external source of power, of a kind used in motor vehicles, including apparatus capable of also receiving radio-telephony or radio-telegraphy, combined with sound recording or reproducing apparatus |
|
852729 |
Radio-broadcast receivers not capable of operating without an external source of power, of a kind used in motor vehicles, including apparatus capable of also receiving radio-telephony or radio-telegraphy, not combined with sound recording or reproducing apparatus |
|
854430 |
Ignition wiring sets and other wiring sets for vehicles, aircraft or ships |
|
902920 |
Speed indicators, tachometers, stroboscopes |
|
940120 |
Seats for motor vehicles |
Source: EPI compilation from United Nations Commodity Trade Statistics Database (United Nations 2012), accessed January 2012
Appendix B. Harmonized Tariff Schedule (HTS) codes used to identify motor-vehicle sector for international trade flows
| HTS Code | Definition |
|---|---|
|
8702 |
Motor vehicles for the transport of 10 or more persons, including the driver |
|
8703 |
Motor cars and other motor vehicles designed to transport people (other than public-transport type), including station wagons and racing cars |
|
8704 |
Motor vehicles for the transport of goods |
|
870530 |
Fire fighting vehicles |
Source: EPI compilation from United Nations Commodity Trade Statistics Database (United Nations 2012), accessed January 2012
References
Anderson, Thomas. 2011. “U.S. Affiliates of Foreign Companies: Operations in 2009.” Survey of Current Business. vol. 91, no. 8, pp. 211-226. http://bea.gov/scb/pdf/2011/08%20August/0811_affiliates.pdf
Bureau of Labor Statistics. 2011. Current Employment Statistics, “Employment, Hours, and Earnings from the Current Employment Statistics Survey (National),” Excel spreadsheets accessed November–December 2011 at http://data.bls.gov/pdq/querytool.jsp?survey=ce. Specific Excel spreadsheets accessed for this report include: for all data, “Not Seasonally Adjusted (NSA)”; for tires, NAICS 32621, series ID: CEU3232621001; for motor vehicles, NAICS 3361, series ID: CEU3133610001; for motor-vehicle bodies and trailers, NAICS 3362, series ID: CEU3133620001; and for motor-vehicle parts, NAICS 3363, series ID: CEU3133630001.
Eisenstein, Paul A. 2011. “Hyundai May Add Second U.S. Assembly Plant: Maker Can’t Meet Demand for Sonata, Other Models.” TheDetroitBureau.com, the Voice of the Automotive World (blog), January 17. http://www.thedetroitbureau.com/2011/01/hyundai-may-add-second-u-s-assembly-plant/
European Automobile Manufacturers Association. 2011. Employment, “Employment 2001-2007,” PDF file accessed December 11 at http://www.acea.be/images/uploads/files/20100902_Employment_2001-2007.pdf.
Haley, Usha C. 2012. Putting the Pedal to the Metal: Subsidies to China’s Auto-Parts Industry from 2001 to 2011. Economic Policy Institute Briefing Paper #316, Washington, D.C.: EPI. http://www.epi.org/publication/bp316-china-auto-parts-industry
Hill, Kim, Debbie Menk, and Steven Szakaly. 2007. Contribution of the Motor Vehicle Supplier Sector to the Economies of the United States and Its 50 States. Ann Arbor: Center for Automotive Research. http://www.cargroup.org/documents/MEMA-Final2-08-07.pdf
Hill, Kim, Debbie Maranger Menk, and Adam Cooper. 2010. Contribution of the Automotive Industry to the Economies of all 50 States and the United States. Ann Arbor: Center for Automotive Research. http://www.cargroup.org/pdfs/association_paper.pdf. “Appendix A: State Level Employment Contributions, ALL JOBS – PARTS” is the source for tables 1–3 in this report.
Houseman, Susan. 2011. “Research Spotlight, Offshoring and Import Price Measurement: Selected Research from the Conference on ‘Measurement Issues Arising From the Growth of Globalization.’”Survey of Current Business, vol. 91, no. 2, pp. 7-11. http://www.bea.gov/scb/pdf/2011/02%20February/0211_napa.pdf
Hyundai Motor Manufacturing Alabama. 2011. Hyundai, “About HMMA.” Corporate webpage accessed December 2011 at http://www.hmmausa.com/?page_id=79/
Kia Motor Manufacturing Georgia, Inc. 2011. KIA, “About KMMG.” Corporate website accessed December 2011 at http://www.kmmgusa.com/about-kmmg/our-history/
Klier, Thomas J. and James M. Rubenstein. 2009. “Imports of intermediate parts in the auto industry – a case study.” Paper presented at a conference on Measurement Issues Arising from the Growth of Globalization, W.E. Upjohn Institute for Employment Research and the National Academy of Public Administration. http://www.upjohn.org/measurement/klier-rubenstein-final.pdf
LMC Automotive. 2011. Public Data, “China Light Vehicle Sales – October 2011,” PDF file last revised November 15, accessed at http://lmc-auto.com/wp-content/uploads/2011/10/China-Monthly-Sales-Report-Nov11.pdf. Note: LMC Automotive acquired the automotive forecasting division of J.D. Power and Associates (a business unit of The McGraw-Hill Companies) on November 1, 2011.
Meyerson, Harold. 2011. “Back from China.” The American Prospect, vol. 10, no. 22, November 29. http://prospect.org/article/back-china
Office of Transportation and Machinery, U.S. Department of Commerce. 2011. “On the Road: U.S. Automotive Parts Industry Annual Assessment,” PDF file accessed at http://trade.gov/static/2011Parts.pdf
Scott, Robert E. 2011a. Growing U.S. Trade Deficit with China Cost 2.8 Million Jobs Between 2001 and 2010: Hundreds to Thousands of Jobs Displaced In Every U.S. Congressional District. Economic Policy Institute Briefing Paper #323, Washington, D.C.: EPI. http://www.epi.org/publication/growing-trade-deficit-china-cost-2-8-million/
Scott, Robert E. 2011b. The Benefits of Revaluation: Full Revaluation of the Chinese Yuan Would Increase U.S. GDP and Employment, Reduce the Federal Budget Deficit, and Help Workers in China and Other Asian Countries. Economic Policy Institute Briefing Paper #318, Washington, D.C.: EPI. http://www.epi.org/publication/revaluing_chinas_currency_could_boost_us_economic_recovery/
Stewart, Terrence P., Elizabeth Drake, Philip A. Butler, Jumana Misleh, Ping Gong, Jessica Wang, Ni Y. Meggers, and David DePrest. 2012. Trade Flows from Stewart and Stewart, China’s Support Programs for Automobiles and Auto Parts Under the 12th{{ }}Five-year Plan. Washington, D.C.: Law Offices of Stewart and Stewart. Forthcoming (scheduled for release on January 31). http://www.stewartlaw.com/stewartandstewart/Publications/tabid/119/language/en-US/Default.aspx
United Nations. 2012. United Nations Commodity Trade Statistics Database, “Data Query, Basic Selection: comtrade_trade_data,” Excel spreadsheets accessed January 12 at http://comtrade.un.org/db/dqBasicQuery.aspx
U.S. Census Bureau. 2011. Foreign Trade: Historical Series. “U.S. Trade in Goods and Services – Balance of Payments (BOP) Basis,” PDF file last revised June 9, accessed at http://www.census.gov/foreign-trade/statistics/historical/gands.pdf
Ward’s Automotive Group. 2012. WardsAuto: Public Data, Excel spreadsheets accessed January 11 at http://wardsauto.com/public-data. Specific Excel spreadsheets accessed for this report: “U.S. Vehicle Sales Market Share by Company, 1961-2010,” http://wardsauto.com/keydata/historical/UsaSa28summary ; “U.S. Car and Truck Sales, 1931-2010,” http://wardsauto.com/keydata/historical/UsaSa01summary; “U.S. Light Vehicle Sales Summary, December 2011,” http://wardsauto.com/keydata/USSalesSummary
Endnotes
1. Hill, Menk, and Cooper (2010, 8) report that the motor-vehicle assembly and parts manufacturing industry “is the second largest employer within the subset of manufacturing.” Data suggest that jobs in auto parts and tires account for nearly two-thirds or more of total direct jobs in the motor-vehicle sector: Jobs in auto parts and tires were responsible for at least 64.3 percent of total direct employment in the motor-vehicle sector in 2010 (Bureau of Labor Statistics 2012), but this figure does not include jobs in the affiliated industries, such as motor-vehicle plastics, that were included by Hill, Menk, and Cooper (2010, 32–33) in the 1.6 million jobs noted earlier.
2. We don’t have comparable data for sales or output in auto parts. Since employment typically makes up about 70 to 80 percent of output in most industries, the number of employees is an excellent indicator of the level of output in auto parts.
3. U.S. auto sales are estimated from three spreadsheets obtained from Ward’s Automotive Group (2012). “U.S. Vehicle Sales Market Share by Company, 1961–2010” was used to obtain the combined market share of U.S.-based automakers (GM, Ford, and Chrysler). “U.S. Car and Truck Sales, 1931–2010” includes U.S. total car and truck sales of domestic and foreign-based automakers. These data were combined with the market share of U.S.-based automakers to estimate their total vehicle sales for the years 1994–2010. “U.S. Light Vehicle Sales Summary, December 2011” was used to calculate total annual sales of U.S.-based automakers in 2011, and their share of total light vehicle sales. These data were used to estimate changes in U.S.-based automakers sales and market share over the 1994–2011 period.
4. See Methodology section for details on sources of data and calculations for all Figures in this report. Employment data in Figure A are not seasonally adjusted—seasonally adjusted employment data are not available from the Bureau of Labor Statistics at this level of industry detail. Hence, we have chosen to compare employment in the same month in 2000, 2007, and 2011 in Figure A to eliminate seasonal factors from the analysis. For 2009, data from July were used, as that was the low point of industry employment in the 2009 crisis.
5. The total U.S. trade deficit in autos and parts declined from $112.8 billion in 2001 to $106.7 billion in 2010 (United Nations 2012). This small decline reflects a shrinking deficit in assembled motor vehicles almost entirely offset by a sharply rising deficit in auto parts, as shown in Figure B. Thus, auto parts’ rising share of the total motor-vehicle sector trade deficit reflects both an absolute rise in the auto-parts deficit, and an absolute fall in the value of motor-vehicle imports.
6. Hill, Menk, and Szakaly (2007, 8), provide the following examples of U.S. automakers’ growing reliance on foreign suppliers:
Siemens, a German supplier, which had no share of audio systems in North America in 2003, had grown to 25 percent share by 2005. Also, Denso Corporation, now the largest supplier in the world, reported that its sales to the Detroit 3 were rising and that the North America market represented about 40 percent of its total sales, while Toyota accounted for another 40 percent of Denso’s business in North America. In August 2008, Chrysler named Denso Corporation as its first “Supplier of Choice.” This means Denso is the default supplier with whom other suppliers must compete to win contracts, and Denso will not have to compete to keep current orders.
7. The Korean auto-parts trade deficit has also grown rapidly, as transplant production has accelerated in 2010 and 2011 after the opening of a second Hyundai Motor Group assembly plant in Georgia in late 2009. Hyundai Motor Group makes and markets vehicles under the Kia and Hyundai brand names. Hyundai’s first U.S. assembly plant, located in Alabama, opened in 2005 (Hyundai Motor Manufacturing Alabama 2011). A Kia assembly plant began production in Georgia in late 2009 (Kia Motor Manufacturing Georgia, Inc. 2011). Hyundai is currently considering opening a third U.S. assembly plant (a second plant making Hyundai brand products) (Eisenstein 2011).
8. In 2009, U.S. affiliates of all foreign multinationals were responsible for more than half (52.3 percent) of the total U.S. goods trade deficit. Anderson (2011, Table 8) reports the total goods imports and exports of U.S. affiliates of foreign multinational companies. These firms had an overall trade deficit of $264.7 billion in 2009. The Census Bureau (2011) reports that the total U.S. goods trade deficit in 2009 was $505.9 billion. Foreign affiliates’ share of this deficit was 52.3 percent.
9. Figure C excludes re-exports—which are goods produced in other countries, imported into the host country, and then re-exported to China. See Scott (2010a, Table 1; notes 4 and 5, pp; 6–9; and Appendix, p. 19) for further details.
10. Trade data are annual, but employment data are monthly, and this paper compares employment in November (in most years) to correct for seasonality in the data.
11. Trade deficit shares in 2007 and 2010 were calculated using country trade data from Figure C, relative to the total auto-parts trade deficit from Figure B.
12. Chinese production and consumption of light vehicles has increased significantly over the past decade. Haley (2011, Figure A) showed that sales of cars in China increased 600 percent between 2000 and 2009, and production increased 1100 percent. In 2010, China was the largest market in the world for light vehicles, with total sales of 17.2 million units (LMC Automotive 2011).
13. Figures C, E, and F report two slightly different estimates of the bilateral U.S.-China auto-parts trade balance in 2010: Figure C reports that the United States estimates that its trade deficit in auto parts with China was $9.1 billion, but Figures E and F report that China estimates that its trade surplus in auto parts with the United States was $8.8 billion. Many factors could contribute to the slight variation in these two estimates. The most important may be timing differences (the date a shipment leaves China can be weeks or months before that shipment arrives in the United States, and vice versa; hence particular import and export shipments can be included in the data for 2010 for China and 2011 for the United States, for example. Also, as pointed out in note nine, Figure C excludes re-exports from the United States to China, while Figures D and E do not (due to data limitations). Exclusion of re-exports results in a slightly larger estimate of the bilateral U.S.-China trade deficit in Figure C. There may also be differences in the way shipments are valued in each country. Finally, reporting problems, especially on the export side, may result in an under-estimate of one or both partners’ exports.
14. Re-exports were included in Figure F, unlike Figure C, due to data limitations. Re-exports were negligible in the case of U.S. trade with China in Figure C, amounting to less than $200 million in every year between 2000 and 2010.
15. The total U.S. auto sector includes direct employment for auto assembly (NAICS 3361), auto bodies and trailers (3362), auto-parts (3363), and tires (32621). Employment data in Figure A and discussed elsewhere in this report covers only the auto-parts and tire industries. Total U.S. auto-sector employment is discussed here for comparison with comparable European employment data only.
