Briefing Paper #241
Climate change is the most important environmental issue facing the United States and the world. The Intergovernmental Panel on Climate Change has concluded that the “scientific evidence for warming of the climate system is unequivocal” (NASA Jet Propulsion Laboratory 2009). Rising emissions of carbon dioxide and other greenhouse gases (GHGs) are responsible for rising global temperatures, shrinking global ice masses, rising sea levels, and increasing the intensity of tropical storms. Continued change, aside from the obvious cost in human lives, would also entail potentially enormous economic costs. It is essential for the United States to develop strong and effective GHG regulations and to negotiate an international treaty to bring about global reductions in GHG emissions.
A well-designed climate policy can support the economic recovery, and green investments can support millions of new jobs, starting with the creation of over 1 million new jobs in the next two years (Bivens, Irons, and Pollack 2009) and ensuring that U.S. manufacturing comes back stronger and cleaner than before.
Poorly designed climate change policies, however, could slow or halt the recovery of significant segments of U.S. manufacturing—as identified in this report— and could even lead to increased global production of GHGs. It is essential for the United States to enact climate change policies that ensure a strong, broad-based recovery of the economy and encourage the growth of domestic manufacturing. One of the keys to achieving these goals is to include a border adjustment mechanism—a fee on the carbon content of goods imported from countries that do not restrict GHG emissions—in U.S. climate change policies.
Most policy proposals to redress climate change are based on the idea that assessing a cost on emissions will create incentives to produce goods more efficiently (with fewer GHG emissions) and switch consumption to other products that generate fewer GHGs in production or use. In June, the U.S. House of Representatives approved HR 2454, The American Clean Energy and Security Act (ACES), a bill developed under the leadership of Henry Waxman, Chairman of the House Committee on Energy and Commerce, and Energy and Environment subcommittee Chairman Edward Markey. This bill includes a “cap and trade” measure to reduce GHG emissions in the United States and is based on similar plans first implemented in the EU in 2005 (since revised, German Marshal Fund 2009).1 Under this system, GHG emissions would be capped beginning in 2012 and reduced by 17% by 2020, relative to emissions in the base year of 2005 (Rego 2009). The EPA would distribute and/or sell emission allowances, which could be bought and sold in a commodities-like market. In theory, this system will minimize compliance costs. The bill sets aside a pool of allowances for companies in energy-intensive, trade-exposed industries.2 Other policies, such as a carbon tax, have also been considered.
If the United States develops climate change policies that only apply to domestic companies without regard for their effects on trade, two outcomes are likely. Production of energy-intensive manufactured goods, especially price-sensitive manufactured products that already face high levels of import competition, could rapidly be outsourced to countries like China and India that do not restrict GHG emissions. This could lead to loss of jobs in manufacturing and related industries, and to a growing trade deficit.
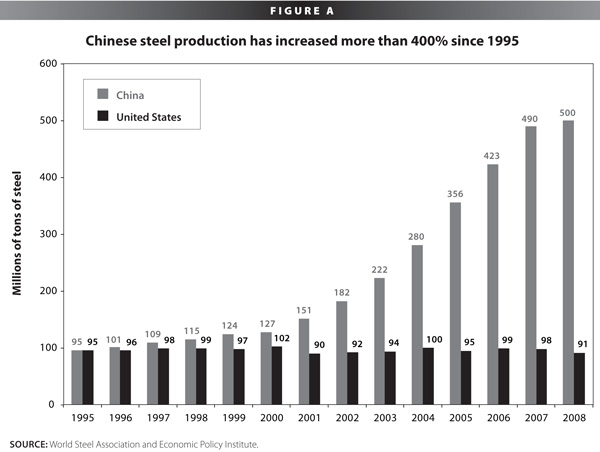
Worse yet, increased production of energy-intensive goods such as iron and steel, pulp and paper, basic chemicals, and glass products in developing countries would be likely to increase net global GHG emissions. American industries are already leaders in energy efficiency and use of pollution controls, but foreign producers in developing countries often lag far behind. For example, the U.S. steel industry has become 25% more energy efficient in the past 20 years. The Chinese steel industry now generates 50% of the carbon emitted by global steel production, but makes only 33% of the world’s steel, meaning that it generates much more carbon per ton than the global average. According to the International Iron and Steel Institute, Chinese steel production generates 2.5 tons of carbon per ton of steel, while U.S. steel production generates only 1.2 tons of carbon per ton of steel (Conway 2009; Bailey et al. 2009, 59). Thus, if Chinese steel is substituted for U.S.-made steel on a ton-for-ton basis, global carbon emissions would rise if domestic production were simply displaced by Chinese production. This is known as the “carbon leakage problem”—the disproportionate increase in carbon dioxide emissions in one country as a result of an emissions reduction by a another country with a strict climate policy—which could occur if the United States implements carbon limits that are stricter than those in other countries. Leakage problems could lead to significant increases in global carbon emissions if border adjustment is not included in cap and trade policies. Fischer and Morgenstern (2009) recently found that “Over the long term, the leakage rate for the few most vulnerable industries can be as high as 40% in the case of a unilateral $10 per-ton carbon dioxide price.”
Chinese steel production more than quintupled between 1995 and 2008, as shown in Figure A, while U.S. steel production was essentially fl at. The growth of steel production in China, rather than in the United States, has contributed measurably to the increase in global GHG production in this period. China’s share of U.S. steel imports more than doubled between January and October 2008, but this share fell off in 2009 in the wake of successful anti-dumping and countervailing duty cases against imports of Chinese steel pipe and tubes.
Carbon pricing will have very uneven effects across industries, and manufacturing is particularly vulnerable to carbon leakage because it is energy intensive and most of its products are highly tradable. This report identifies the 10 most carbon-intensive U.S. manufacturing industries and examines the number and distribution of jobs in these industries. This report also identifies a number of energy-intensive, trade-sensitive, sub-industries at the North American Industrial Classification System (NAICS) six-digit level.3 Key findings include:
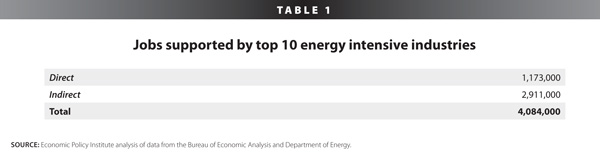
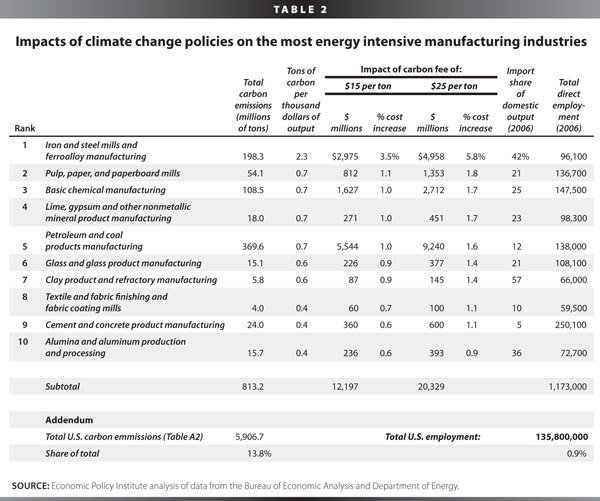
• The top 10 carbon-emitting manufacturing industries including steel, pulp and paper, basic chemicals, nonmetallic mineral products, petroleum refining, glass, clay, textiles mills, cement, and aluminum production emitted 813 million tons of carbon in 2006, 13.8% of total U.S. carbon emissions. These industries directly employed 1.2 million workers, 0.9% of total U.S. employment.
• Overall, about 1.7 million manufacturing jobs are supported by production in these 10 industries, (including indirect manufacturing employment supported by their output). In addition, 400,000 jobs in commodity, utility, and construction industries are also supported by these sectors, along with 2.1 million jobs in services industries.
• Thus, 4 million total jobs are supported by these 10 carbon-intensive industries.
• Most of these industries already face substantial import competition, and imports exceeded 15% of domestic output in seven of the 10 sectors (Table 2), ranging as high as 42% in basic iron and steel and 57% in clay product and refractory manufacturing.
• Total employment supported by these 10 industries is most concentrated in coal producing, petrochemical, and
industrial states. Wyoming leads the list, with 5.3% of state employment (14,700 jobs supported), followed by South Carolina (4.6%, 87,300 jobs), Louisiana (4.4%, 82,400 jobs), West Virginia (4.4%, 33,300 jobs), Texas (4.2%, 425,000 jobs), Alabama (4.2%, 83,100 jobs), Oklahoma (4.1%, 63,200 jobs), Tennessee (3.8%. 105,900 jobs), Ohio (3.6%, 195,200 jobs), and Indiana (3.5%, 103,300 jobs).
• The states with the largest numbers of jobs supported include Texas (424,900 jobs), California (404,800 jobs), Ohio (195,200 jobs), Florida (194,400 jobs), New York (185,000 jobs), Pennsylvania (181,800 jobs), Illinois (177,200 jobs), Georgia (127,100 jobs), North Carolina (122,300 jobs), and Michigan (119,600 jobs).
• The study also examined six carbon-intensive subindustries that would be heavily impacted by climate change policies. Some were components of industries identified above, and others were not. Each would be at least as hard hit as one or more of the top-10 sectors identified above. These industries include carbon black production, iron and steel mills, petrochemical manufacturing, steel products manufactured from purchased steel, synthetic rubber manufacturing, and tire manufacturing. These industries emitted 238 million tons of carbon in 2002, 4.1% of total U.S. carbon emissions. These industries directly employed approximately 400,000 workers, 0.3% of total U.S. employment.
• This study was based on input-output models of the U.S. economy and showed that for 2006 (the most recent year for which complete data are available), the manufacturing sector as a whole generated 20.2% of total U.S. carbon emissions. However, the sector was only responsible for 12.0% of output (value added) in 2006. Data used in the analysis of detailed subindustries were based on benchmark 2002 input-output tables (BEA 2008). Indirect employment and state impacts for these detailed sectors could not be estimated with available data.
If climate change policies are implemented without border adjustment, substantial carbon leakage-related job loss could result in these sectors. Fortunately, there are solutions available to carbon leakage, and Congress is working on several key components of this plan. One solution is to implement a system of border adjustments that would impose a fee on the carbon content of goods imported from countries that do not restrict GHG emissions, thus leveling the domestic playing field by pricing carbon emissions for both domestic goods as well as imports. If, by 2018, the president is unable to negotiate a comprehensive treaty limiting global GHG emissions, the ACES act sets aside a pool of emission allowance rebates for vulnerable, energy-intensive, trade-sensitive industries. The bill also requires the president to implement border adjustment against products from countries that do not adopt strict GHG limits by 2018. This provision could only be waived by a joint resolution on Congress (Rego 2009, HR 2454 Secs. 765-768). A second element of border adjustment— a rebate for exporters based on carbon intensity—would level the playing field abroad. To prevent carbon leakage and manufacturing job loss in energy-intensive industries, border adjustment must be included in the final design of any effective GHG policy based on raising carbon prices that does not include global, industry-specific restrictions on emissions.
The EPA administrator will determine, in part, which individual, six-digit NAICS industries will be eligible for emission allowances under the ACES act (HR 2454). This report identifies the top 10 most vulnerable industries at the four-digit NAICS level (such sectors aggregate a number of six-digit industries). It also examines the vulnerability of a subset of six-digit NAICS industries. Some industries that are highly energy or carbon intensive, and have high levels of import penetration are not particularly vulnerable to carbon leakage because of the economic structure of those sectors. For example, domestically produced crude oil provided only 34% of U.S. crude oil consumption in 2008. At the margin, imports have filled the gap between U.S. domestic supply and demand for decades, and were responsible for 66% of U.S. crude oil consumption in 2008 (Energy Information Administration 2009a). On balance, the United States refines all the finished products consumed in the domestic market, and the United States is a net exporter of refined products. Furthermore, petroleum demand is highly inelastic.4 For these reasons, a cap and trade system is likely to have little impact on demand for refined petroleum products and the output of this sector. Therefore, the ACES act specifically excluded petroleum refining from the list of industries eligible for emission allowance rebates (HR 2454 Sec. 763 (2)(c)).
Jobs supported by carbon-intensive manufacturing industries in the United States
The top 10 carbon emitting industries directly employed 1.2 million workers in 2006, as shown in Table 1. These industries also supported 2.9 million additional jobs in upstream (e.g., mining and construction), other manufacturing, and downstream service (e.g., accounting and advertising) industries. Thus, a total of 4.1 million jobs were supported in these carbon intensive, commodity-based manufacturing industries.
The cost impacts of alternative climate change policies—assuming current production methods—on these industries are illustrated in Table 2, which lists and describes each of these industries. Carbon emissions by 84 detailed manufacturing industries were estimated in this study using an input-output model (described in the Appendix). These industries were ranked on the basis of total carbon emissions per million dollars of output in 2006 (column 2). This ranking is identical to one based on the impact of an equivalent carbon fee (in dollars per ton of carbon emissions) as a share of total costs, as shown in Table 2 (columns 4 and 6). The most carbon-intensive sector was iron and steel mills, which generated 2.3 tons of carbon per million dollars of output in 2006. Other industries in the top 10 included pulp and paper, basic chemicals, non-metallic mineral products, petroleum refining, glass products, clay products, textile mills, cement, and aluminum production. Iron and steel production is particularly carbon intensive because it both requires abundant energy and, in the integrated steel subsector, directly consumes coking coal in the steelmaking process.
With current technologies, coal is the most carbon-intensive form of energy.5 Under a new climate policy, however, we can expect industries to adapt to the new pricing regime by adopting different forms of production. The estimates here can be seen as providing an upper-bound for the carbon-related cost increases by assuming no changes in production technology.
Table 2 also reports total carbon emissions for each of the top 10 industries, and analyzes the economic impacts of two alternative carbon fees (or their equivalents, in a cap and trade system), beginning with $15 per metric ton. The cost of emission fees for each industry are shown in column 3, and these would total $12.2 billion for the top 10 industries at 2006 output levels (assuming no change in production, technology, or emissions controls). As expected, these fees would be highest for iron and steel production (3.5%). Fees for the other nine industries would range from 0.6% to 1.1% of total costs. At $25 per ton (columns 5 and 6), costs would rise proportionately to $20.3 billion for these 10 industries, overall.6
The import share of domestic output is shown in the next-to-last column of Table 2. Most of
these industries already face substantial import competition and imports exceeded 15% of domestic output in 7 of the 10 sectors, ranging as high as 42% in basic iron and steel and 57% in clay product and refractory manufacturing.
Total employment in each of the top 10 industries is shown in the last column of Table 2. The cement and concrete products sector was the largest employer, with 250,000 jobs, followed by basic chemicals (147,500), petroleum products (138,000), and pulp and paper mills (136,700). Total direct employment in these 10 industries was 1,173,000 in 2006, 0.9% of total U.S. employment in that year.
The analysis for this report was prepared using highly aggregated data for four-digit NAICS-codes to define industries.7 Regulations for output-based permits were included in the Doyle-Inslee amendment to the ACES. These allocations are based on much more finely detailed six-digit NAICS industries. Some sectors (such as tires) that are energy and import sensitive (two factors considered in the determination of eligibility for rebates in the Doyle-Inslee amendment) may be more heavily impacted at the six-digit level of analysis. Furthermore, the analysis in Tables 2-4 (which is based on four-digit industries) only considered direct energy use and excluded energy consumed in the production of purchased intermediates.
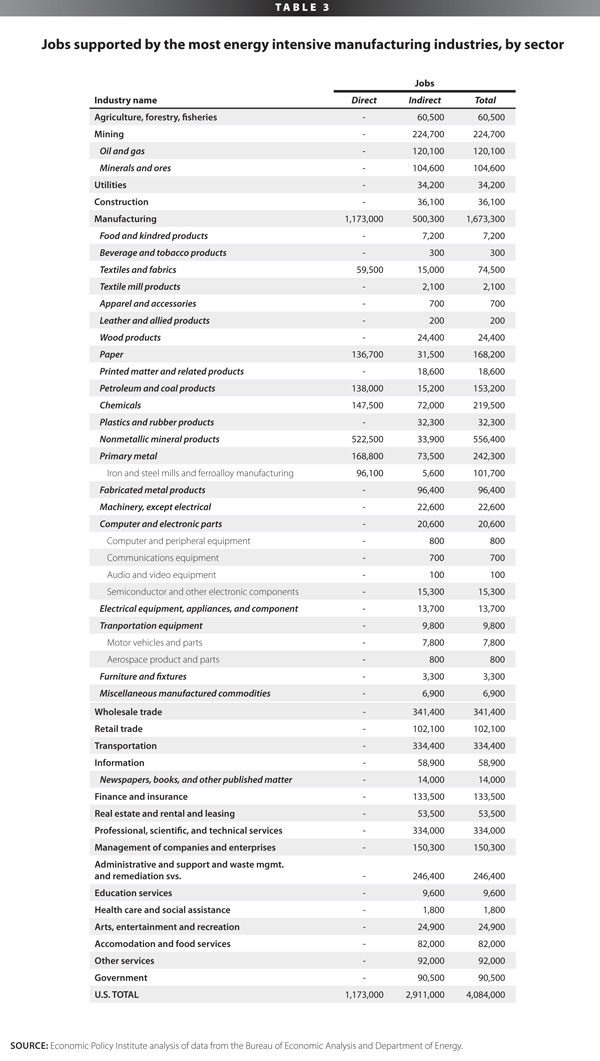
Table 3 includes detailed breakdowns of direct, indirect, and total jobs supported by the 10 most carbon-intensive manufacturing industries. In addition to the 1.2 million direct jobs supported, these industries also support 225,000 jobs in mining industries and more than 100,000 in agriculture, utilities, and construction (column 2). They also supported an additional 500,000 indirect jobs in other manufacturing industries.
By far the largest number of indirect jobs supported is in the services sector. Overall, the 10 manufacturing industries support 355,500 indirect jobs in agriculture, mining, utilities, and construction industries, 500,300 indirect jobs in manufacturing, and 2,055,300 jobs in service industries (these subtotals are not separately shown in Table 3). The most heavily effected service industries include transportation (344,400 jobs), professional, scientific, and technical services (344,000 jobs), and wholesale trade (341,400 jobs).
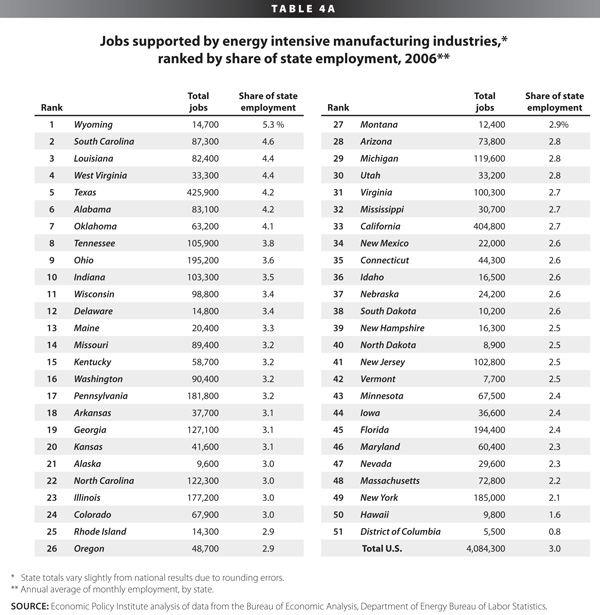
Jobs supported in the states
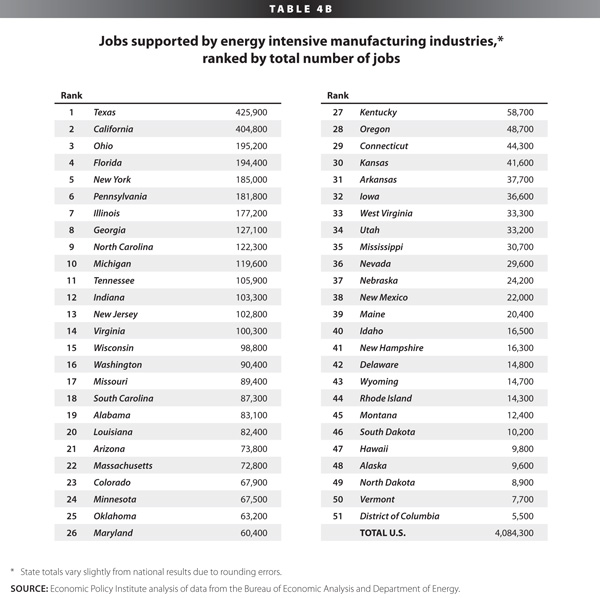
The 10 manufacturing sectors identified in Table 2 support thousands of jobs in every state and the District of Columbia. Jobs supported in each of the states were estimated using data and models developed in Scott (2008). Table 4A shows total jobs supported in each state, and as a share of total state employment in 2006. These industries have their biggest employment impact, as a share of employment, on states that produce large amounts of coal, petrochemicals, and industrial commodities. Wyoming leads the list, with 5.3% of state employment (14,700 jobs supported), followed by South Carolina (4.6%, 87,300 jobs), Louisiana (4.4%, 82,400 jobs), West Virginia (4.4%, 33,300 jobs), Texas (4.2%, 425,000 jobs), Alabama (4.2%, 83,100 jobs), Oklahoma (4.1%, 63,200 jobs), Tennessee (3.8%, 105,900 jobs), Ohio (3.6%, 195,200 jobs), and Indiana (3.5%, 103,300 jobs).The same factors (concentration in energy production or petrochemicals or other industrial commodities shown in Table 2) also contributed to the large numbers of overall jobs supported in each of the states, as shown in Table 4B. Size of the overall economy and employment base also contributed to these rankings—the most jobs were supported in Texas (424,900 jobs) and California (404,800 jobs), the largest states overall, in terms of population and employment. Other large states where larger numbers of job are supported by these industries included Ohio (195,200 jobs), Florida (194,400 jobs), New York (185,000 jobs), Pennsylvania (181,800 jobs), Illinois (177,200 jobs), Georgia (127,100 jobs), North Carolina (122,300 jobs), and Michigan (119,600 jobs).
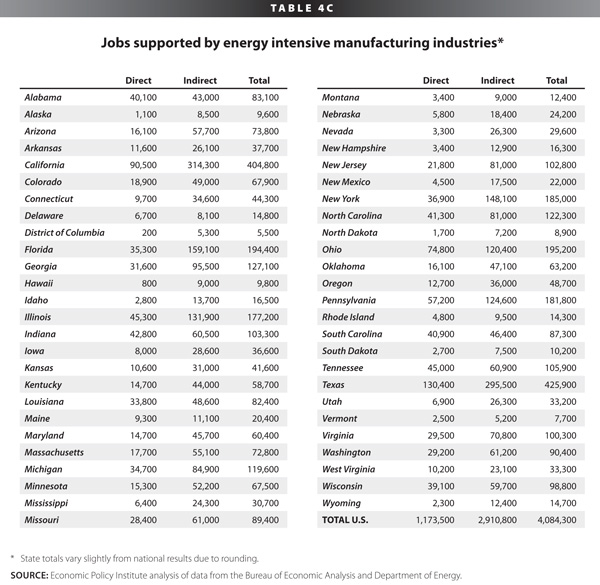
Direct and indirect jobs supported in each state are reported in Table 4C, which ranks states alphabetically. The top five in terms of direct jobs were Texas (130,400), California (90,500), Ohio (74,800), Pennsylvania (57,200), and Illinois (45,300). The rankings were slightly different for indirect jobs supported, where the top five were California (314,300), Texas (295,500), Florida (159,100), New York (148,100), and Illinois (131,900).
Jobs supported in energy-intensive,trade-sensitive subindustries
The ACES (HR 2454) allocates allowances to a number of energy-intensive industries, including both electric utilities and a number of trade-sensitive manufacturing sectors. The legislation directs the administrator of the Environmental Protection Agency (EPA) to allocate emissions allowances to six-digit NAICS industries based on both energy or carbon intensity and trade intensity.8 Thus, it is important to examine the impacts of carbon intensity for detailed, NAICS six-digit industries to gain a deeper understanding of the types of industries that are likely to be most impacted by climate change policies.
A group of six, energy-intensive manufacturing industries was selected for further analysis. There are 277 six-digit industries identified in publicly available, 2002 benchmark input-output tables. The industries chosen were selected based, in part, on industry feedback, and the list is not comprehensive.
The primary criterion for inclusion in the top-10 list shown in Table 2 above was estimated carbon intensity, (column 2, tons of carbon per million dollars of output). Table 5 contains similar data for each of the detailed six-digit NAICS industries included in this study. Each of these sub-sectors was more carbon intensive than at least three of the top-10 industries shown in Table 2. The minimum carbon intensity of the six industries shown in Table 5 was 0.6 tons per million dollars of output (for the tire industry), ranging up to a high of 5.3 million tons per million dollars (in carbon black manufacturing). The other carbon-intensive sub-industries in Table 5 are iron and steel mills and ferroalloy manufacturing, petrochemical manufacturing, steel product manufacturing from purchased steel, and synthetic rubber manufacturing.
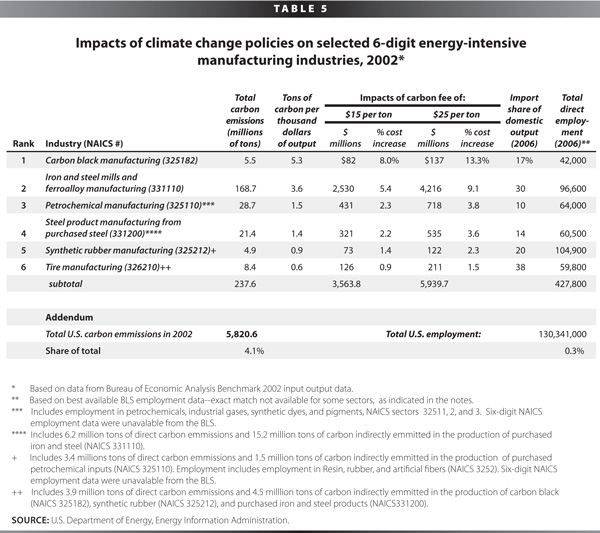
The analysis for this section included indirect carbon inputs for several sectors, as noted in Table 5. This includes, for example, the carbon released in basic steel manufacturing, which is allocated to steel product manufacturing from purchased steel in proportion to that sector’s use of basic steel. This analysis assumes that all inputs originate from domestic sources. To the extent that inputs are imported from countries that do not implement GHG cap and trade systems, this may overstate the cost of indirect carbon consumption.9 Sourcing of indirect inputs is an issue that may require attention from the EPA administrator.
If carbon emission allowances trade for $15/ton, the production costs of the six industries shown in Table 5 would increase by 0.6% to 8.0%. It should be stressed that this analysis is based on 2002 data and an incomplete assessment of indirect carbon consumption. Actual energy use and GHG intensity will depend on more current data and compr
ehensive energy and GHG analysis.
Each of the six sub-industries is heavily trade-impacted, with 2006 import penetration ratios ranging from 10% in petrochemicals to 38% in tires. Detailed employment data were unavailable for petrochemicals and for synthetic rubber, so slightly more aggregated employment data are shown for these sectors. Overall, approximately 400,000 workers were directly employed in these industries in 2006.
Conclusion
Manufacturing industries are economically desirable for a number of reasons. First, they have historically been the primary source of middle-class jobs with good wages and benefits, especially for workers without a college degree, who still make up 69% of the U.S. labor force (Mishel et al. 2009, 168). Manufacturing industries also support large numbers of secondary jobs in industries that provide key upstream and downstream inputs into their production. Furthermore, more than half of all U.S. research and development is performed by the manufacturing sector, despite the fact that it is responsible for only 20% of GDP. Rebuilding the U.S. manufacturing sector will be an essential element in rebuilding an innovative, diversified, and sustainable economy.
Without complementary policies, carbon-intensive, import-sensitive industries could see increased competition from less-regulated counterparts abroad. This could come at a cost to domestic competitiveness as well as higher global GHG emissions, as production is shifted from relatively efficient domestic producers to carbon-intensive foreign sources. In addition, if the U.S. manufacturing base is allowed to decline, it will reduce the ability of the United States to innovate new green technologies that will reduce our compliance costs over the long run. Thus, a comprehensive climate change policy should include border adjustment provisions to ensure that global emission reduction goals are met.
Appendix: Estimating the number of jobs supported by production in carbon-intensive manufacturing industries
The estimates developed in this report are based on U.S. input-output data for 2006. The model has three components. The first step involved analysis of a U.S. nominal input-output “use” table for 2006. “The ‘USE’ matrix contains the sales of commodities sold to intermediate consumers and final demand. In addition, it contains the intermediate inputs and value-added factors of production to industries. Each column sums to its respective industry output. Each row sums to its respective commodity output” (Chentrens 2007, 2). The use matrix is a 202 x 202 sector model of the domestic economy.
“This matrix contains intermediate inter-industry inputs plus value added (row 202) for the year specified in the matrix name. This matrix also contains intermediate inter-industry sales plus final demand (column 202) for the year specified in the matrix name. Each column sums to its respective industry output. Each row sums to its respective commodity output (Chentrens 2007, 3).” The 201 rows and columns in the model correspond to a comprehensive list of industries that make up the domestic economy. The first 201 columns of the matrix sum to total intermediate demand for each commodity.
In this analysis, the final “aggregate” demand for each sector’s output was replaced with apparent consumption (consumption plus investment plus government spending plus imports less exports), to more closely approximate total domestic consumption of energy and other products in the economy.
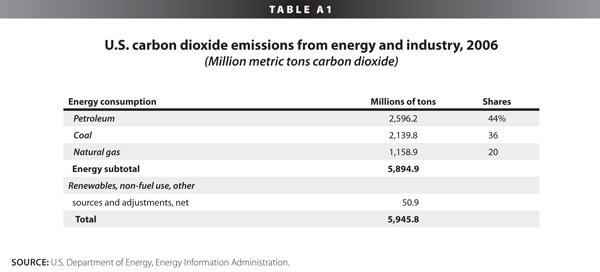
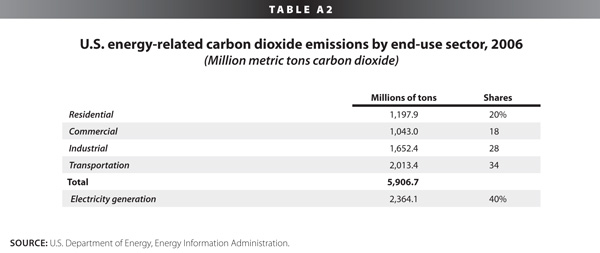
The vast majority (over 99%) of carbon is emitted in the United States during the combustion of just three fuels: petroleum, coal, and natural gas, as shown in Table A1. Use of each of these fuels was allocated to their final uses in the “Use” matrix: coal (BLS industry 8) directly to final users (primarily electricity generation and steelmaking); natural gas distribution (in part sold directly from crude petroleum and natural gas (industry 7) to electric power generation and distribution (industry 12) and most sold through wholesale and retail natural gas distribution systems (industry 13); refined petroleum products are distributed by the petroleum and coal products manufacturing industries (industry 43). In addition, approximately 40% of all carbon from coal, oil, and natural gas is consumed in the generation of electricity (Table A2).10
For each of these final energy supply sectors, total carbon emissions were allocated to intermediate demand plus apparent consumption on a proportional basis. For example, total expenditures on coal were $26.9 billion in 2006 (all data in nominal terms); 2,139.8 million tons of carbon was emitted from coal consumption, or $13 million per ton of carbon emitted. Thus carbon was allocated to each of the 201 industries that used coal according to this average ratio. Similar procedures were followed with natural gas, petroleum, and electricity.
This analysis generated estimates of carbon emissions by fuel type for each of the 201 industries in the model. These results were used to identify the top 10 most carbon intensive manufacturing industries in the United States, shown in Table 2, above.
In the second phase of the analysis, direct and indirect employment effects were estimated at the national level. Direct employment in each sector in 2006 was obtained from the BLS employment projections macroeconomic data set. The employment requirements table was used to estimate direct employment in each to the top 10 hardest-hit manufacturing industries.
The employment requirement tables “are derived from input-output data, and show in each column the employment generated directly and indirectly across all industries by a million dollars production of a given industry’s primary product. The data can give an indication of the relative impact of different industries’ primary production” (Bureau of Labor Statistics 2007).
The nominal domestic employment requirements table for 2006 reports only the domestic employment supported by the production of a million dollars worth of output in each sector. This table was used to estimate indirect employment multipliers for this report. The column vector for each industry was divided by the direct labor coefficient for that sector to estimate the number of indirect jobs supported by each direct job in that industry. This procedure was followed for each of the top 10 most carbon-intensive manufacturing industries. These coefficients were used to estimate the total number of jobs indirectly supported by employment in each of the 10 hardest hit industries. These results are summarized in Tables 1 and 3, above.
The final step in the analysis involved estimating the distribution of jobs supported identified in Tables 2 and 3 on a state-by-state basis. This analysis was prepared using employment-by-state-by-industry coefficients prepared for Scott (2008). These data were collected from the Census current population survey. Procedures used in the state-by-state analysis are described there.
—The author thanks Kathryn Edwards for research assistance and Josh Bivens, John Irons, Ethan Pollack, and Erin Weir for comments.
—EPI is grateful to the Alliance for American Manufacturing for support of our research and publication programs.
Endnotes
1. Cap and trade systems establish limits on carbon emissions by country and industry and requir
e firms to obtain permits to emit carbon and other GHGs either from the government (an allocation) or in the market. There are policies that allow firms to obtain emission credits from investments in other countries that reduce global carbon emissions (or increase natural removal of carbon from the atmosphere. In general, the intent of these policies is to establish a price on carbon emissions, to create incentives to reduce national and global carbon emissions, and to increase carbon absorption through natural means (such as increased forestation). Measures such as emission banking have also been introduced in some countries to manage the supply of permits in order to avoid large variations in carbon prices.
2. Rego (2009) summarizes the essential elements of this measure:
“The ‘cap’ in ‘cap and trade’ consists of a series of annually decreasing limits on overall U.S. greenhouse gas emissions, beginning in 2012 and reaching a 17% reduction (compared to 2005 levels) by 2020 and an 83% reduction by 2050. The bill would initially apply to electric utilities, fuel refineries, and certain industries (representing 66% of total U.S. emissions), with additional industrial sources covered in 2014 and natural gas distributors added in 2016, ultimately bringing about 85% of U.S. greenhouse gas emissions within the cap and trade system.
U.S. EPA would distribute emission allowances (collectively equal to the annual overall emissions cap) among affected emitters, who must annually collect enough allowances or off set credits (described below) to equal their actual emissions. Initially, about 70% of available allowances would be allocated among affected industries for free, reducing compliance costs that would otherwise be passed on to consumers, and about 30% would be auctioned to raise funds for assistance to low-income energy consumers. Over time, the percentage of allowances being auctioned would increase until reaching about 70% for 2031 and the years after.
The House bill includes guidelines for allocating free allowances among the affected industries, with the lion’s share (43.75%) going to electric utilities. Interestingly, although the transportation sector accounts for approximately 30% of U.S. greenhouse gas emissions, petroleum refiners—who are responsible under cap and trade for all emissions attributable to their products— would receive only 2.25% of available allowances for free.
The ‘trade’ in ‘cap and trade’ occurs when those with extra emission allowances or offset credits sell them via commodity-like “carbon markets” to those who need more. In theory, the opportunity to buy and sell credits minimizes the overall cost of compliance, as those emitters that can reduce emissions more cheaply than the market price do so and sell the credits at a profit to those emitters who cannot.”
3. Under the terms of the House climate change bill a number of industries, defined at the NAICS six-digit level, would receive relief from the cost of carbon emission credits in the form of production credits (see below).
4. Between 2005 and 2008 the average spot price of Oklahoma crude oil (a benchmark indicator) increased 76% (Energy Information Administration 2009b) and total domestic consumption of crude oil decreased 3.5% (Energy Information Administration 2009a). This implies an overall price elasticity of petroleum demand between 0 and -0.1, which is highly inelastic. Note that more than half of (2.1 percentage points) of the decline in crude oil consumption occurred in the recession year of 2008, when declining income contributed to the fall in consumption.
5. See Office of Atmospheric Programs, EPA (2009). This study assumes allowance prices of $13 – $17 per metric ton of carbon dioxide equivalent in 2015 (executive summary p. 2).
6. The EPA model assumes that carbon allowance prices would rise to $17-$22 per ton in 2020. Other analysts assume allowance prices in the range of $25 per ton (personal communication, Pew Foundation).
7. The North American Industrial Classification System (NAICS) was developed by the U.S. Department of Commerce and its counterparts in Canada and Mexico to describe economic activities.
8. HR 2454, sec. 763.
9. If border adjustment fees are implemented, as discussed above, they could raise the cost of imported, GHG-intensive intermediate products.
10. No carbon was allocated to primary production of crude oil and natural gas (industry 7, direct consumption). Only consumption of coal, distributed natural gas, electricity, and refined petroleum products were allocated to this industry. This clearly results in under estimates of carbon emissions from this sector since direct consumption of gas (e.g., through flaring) and other petroleum products clearly generated substantial carbon emissions. However, this problem was not relevant to the present analysis, which focused on carbon use in manufacturing industries. Double counting and accurate allocation of carbon between crude, refined, and distributed products is a key subject for future research. It is most relevant to estimates of carbon emissions in the petroleum refining sector (manufacturing industry 43), where burning of crude products no doubt accounts for a significant volume of carbon emissions. Nonetheless, this sector did appear in the list of the top 10 energy using industries, based solely on its consumption of the delivered, final products listed above.
References
Bailey, Buzz, Paul Hoff, Ma Tianjie, Peter Matthews, Rachel Rothschild, Joel Swerdlow, Yvon Wang, and Richard Wegman. 2009. An Assessment of Environmental Regulations in the Chinese Steel Industry. Washington, D.C.: Alliance for American Manufacturing. http://www.americanmanufacturing.org/assessmentof-china/
Bivens, Josh, John Irons, and Ethan Pollack. 2009. Green Investments and the Labor Markets: How Many Jobs Could Be Generated and What Type? Issue Brief #253. Washington, D.C.: Economic Policy Institute.
Bureau of Labor Statistics. 2007. Employment Requirements Matrix. http://www.bls.gov/emp/empind4.htm
Caldwell, Jake. 2009. “Climate Change and International Competitiveness.” Washington, D.C.: Center for American Progress. April 7. http://www.americanprogress.org/issues/2009/04/ climate_emission.html
Chentrens, Carl. 2007. “Employment outlook: 2006-2016. Layout and Description for 201-Order Input-Output Tables: 1998 through 2006 Historical and Projected 2016” Washington, D.C.: U.S. Bureau of Labor Statistics. December. http://www. bls.gov/emp/empind3.htm, Inter-industry relationships (Input/ output matrix): Nominal dollar input-output data for 19982006 with documentation.
Conway, Thomas M. 2009. Testimony before the Subcommittee on Energy and Environment of the Committee on Energy and Commerce, U.S. House of Representatives. April 23.
Energy Information Administration. 2009a. “Spot Prices for Crude Oil and Petroleum Products: Cushing, OK WTI Spot Price FOB (Dollars per Barrel), Annual Average.” http://tonto. eia.doe.gov/dnav/pet/hist/rwtcA.htm
Energy Information Administration. 2009b. “U.S. Crude Oil Supply and Disposition: Series History.” http://tonto.eia.doe. gov/dnav/pet/pet_sum_crdsnd_adc_mbbl_m.htm
Fischer, Carolyn, and Richard D. Morgenstern. 2009. Competitiveness, Emissions Leakage, and Climate Policy. Washington, D.C.: Resources for the Future. http://www.rff .org/Publications/WPC/Pages/09_02_27_Competitiveness_Emissions_ Leakage_Climate_Policy.aspx
German Marshall Fund. 2009. “Summary: GMF Even Examines Economic Competitiveness and Cap-and-Trade Policy on Capitol Hill.” March 26. http://www.gmfus.org/event/detail. cfm?id=566&a
mp;parent_type=E
Mishel, Lawrence, Jared Bernstein, and Heidi Shierholz. Th e State of Working America 2008/2009. An Economic Policy Institute book. Ithaca, N.Y.: ILR Press, an imprint of Cornell University Press.
Mufson, Steven. 2007. Europe’s problems color U.S. plans to curb carbon gases. The Washington Post. April 9. P. A01.
NASA, Jet Propulsion Laboratory. 2009. “Global Climate Change: NASA’s Eyes on the Earth.” http://globalclimatechange.jpl.nasa.gov/evidence/
Office of Atmospheric Programs, Environmental Protection Agency. 2009. “EPA Preliminary Analysis of the Waxman-Markey Discussion Draft: The American Clean Energy and Security Act of 2009 in the 111th Congress. April 20. http:// www.epa.gov/climatechange/economics/economicanalyses. html#wax
Rego, John A. 2009. “United States: House Passes Waxman-Markey Climate Change Bill, But Just Barely.” Jones Day/ Mondaq Environmental & Energy. http://www.mondaq.com/ article.asp?articleid=82810
Scott, Robert E. 2008. The China Trade Toll: Widespread wage suppression, 2 million jobs supported in the United States. Washington, D.C.: Economic Policy Institute. July 28. http:// www.epi.org/publications/bp219/
