November 1, 2007 | EPI Briefing Paper #203
The erosion of employment-based insurance
More working families left uninsured
by Elise Gould
The decline in health insurance coverage continued unabated in 2006, driven primarily by the continued erosion in employer-provided health insurance. In 2006, 47 million Americans were uninsured, up nearly 8.6 million since 2000. The rate of those without insurance has grown 2.1 percentage points during this period, from 13.7% in 2000 to 15.8% in 2006.
Employment-based coverage is still the most prominent form of health insurance in the United States at 59.7% of all Americans; however, the rate of this coverage has fallen in every year since 2000. In 2000, 64.2% of Americans had employer-provided health insurance. By 2006, this percent had fallen 4.5 percentage points. Nearly 2.3 million fewer Americans had employment-based insurance in 2006 than in 2000. This decline does not take into account population growth. As many as 13 million more people would have had employer-provided health insurance in 2006 if the coverage rate had remained at the 2000 level.
Because of these large declines in employer-provided health insurance, workers and their families have been falling into the ranks of the uninsured at alarming rates. There were almost 5 million more uninsured workers in 2006 than in 2000. While uninsured workers are disproportionately young, non-white, less educated, and low wage, workers across the socio-economic spectrum have experienced losses in coverage. Even the most highly educated and highest wage workers had lower rates of insurance coverage in 2006 than in 2000.
As with workers, the downward trend in employer-provided coverage for children (through their parents’ employers) continued into 2006: 3.4 million fewer children had employment-based coverage in 2006 than in 2000. From 2000 to 2004, children were less likely to become uninsured as public-sector health coverage expanded. In 2005, that trend reversed and the number of uninsured children rose by 940,000 to over 8.6 million by 2006. This is the second year in a row that the rate of uninsured children has increased.
The safety net health programs—Medicaid and the State Children’s Health Insurance Program (SCHIP)—have kept millions of families insured when their employment-based benefits were lost. Unfortunately, medical inflation and state budget constraints have weakened this safety net. Congress has passed valuable legislation to strengthen SCHIP, however, President Bush vetoed their vote.1 Had the bill passed, 3.8 million more children would have been covered by health insurance (CBO 2007).
While Medicaid and SCHIP still work for many, it is clear that the government has not picked up coverage for everybody who lost insurance. The weakening of this system—notably for children—is particularly difficult for workers and their families in a time when they are facing the challenges of stagnant incomes. Though increases in employer-provided health insurance premiums have slowed, they are still much higher than the rate of wage growth or overall inflation (KFF 2007). Even for middle- or high-income families, serious unexpected illness can lead to grave financial difficulty or bankruptcy (Himmelstein et al. 2005).
Given the erosion of employer-provided health insurance and rising costs of medical care, now is a critical time to consider health insurance reform.2
This report’s central findings include:
• The number of uninsured Americans rose by nearly 8.6 million, from 38.4 million in 2000 to 47.0 million in 2006. This increase was due primarily to the precipitous decline in employer-provided health coverage for workers and their families.
• Nearly 3.9 million fewer Americans under 65 had employer-provided coverage in 2006 than in 2000. As many as 14 million more people under 65 would have had employer-provided health insurance in 2006 if the coverage rate had remained at the 2000 level.
• The downward trend in the rate of employer-provided health insurance continued for the sixth year in a row, from 68.3% to 62.9%.
• Individuals among the bottom 20% of household income were the least likely to have employer coverage; 21.9% of the bottom income quintile were covered compared to 86.2% for people in the highest income quintile.
• Jobholders experienced a significant decline in health insurance coverage from 2000 to 2006. In 2000, 74.8% of workers had employer-provided coverage, whereas 70.8% of workers had coverage in 2006.
• No category of workers was insulated from loss of coverage. Even full-time workers, workers with a college degree, and workers in the highest wage quintile experienced declines in coverage between 2000 and 2006.
• Children experienced declines in employer-provided health insurance coverage in each of the last five years. In 2000, 65.9% of children had employer-provided coverage, whereas in 2006 only 59.7% did, a fall of over 6 percentage points. Public health insurance is no longer offsetting these losses: for the second year in a row, the rate of uninsured children has increased.
• Coverage rates in California are lower on average than the nation as a whole, but the negative trend from 2000 to 2006 is similar to the national trend. Nearly all of the losses in employment-based coverage occurred among children.
• The decline in employer coverage was pervasive and felt throughout the country. When comparing the 2000-01 and 2005-06 periods, 38 states experienced significant losses in employment-based coverage for the under 65 population, with Utah, South Carolina, Maryland, and Georgia experiencing losses in excess of 7 percentage points. No state experienced a significant increase in their employer-provided coverage rate.
Overall declines in coverage
Declines in employer-provided health insurance were the leading force behind the declines in overall health insurance coverage from 2000 to 2006. As shown in Table 1, losses in coverage among the under-65 population were driven by losses in coverage among adults.3 While the overall insurance rates among children were essentially unchanged, individuals between 18 and 64 years old experienced declines of 3.1 percentage points.
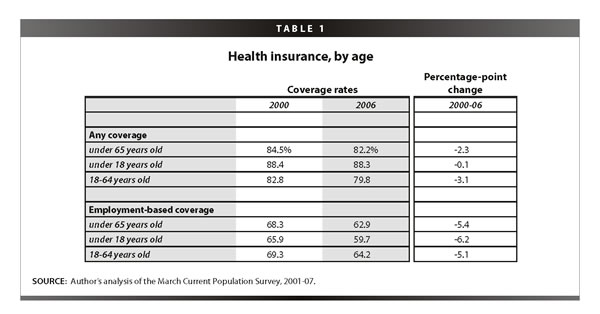
The overall losses in coverage were 2.3 percentage points from 2000 to 2006; employment-based coverage dropped at over twice that rate, falling 5.4 percentage points. In contrast to overall declines in coverage, losses in employment-based coverage were more equally split between adults and children. These losses are driving the increases in rates of uninsurance, moderated only by gains in public insurance and, in some cases, purchase in the private, nongroup market.
Table 2 examines employment-based coverage for non-elderly adults (18-64-year olds). Insurance losses for these individuals are driven by coverage through their own job rather than coverage as dependents (primarily spouses). Private wage and salary workers make up 76% of the workforce, and it is this group that has seen the largest losses in coverage. Workers with strong attachments to the labor force (about 89% of the private wage and salary workforce) are more likely to have coverage than marginally attached workers (58.7% vs. 13.9%). Surprisingly, it is these attached workers who have seen larger declines in coverage: 4.1 vs. 1.7 percentage point declines.
Declines in overall employer-provided coverage
About 3.9 million fewer people under the age of 65—including workers, their spouses, and their children—had employer-provided health insurance in 2006 than in 2000. The percent with employer-provided health insurance fell from 68.3% in 2000 to 62.9% in 2006, a decline of 5.4 percentage points (Table 3 ).
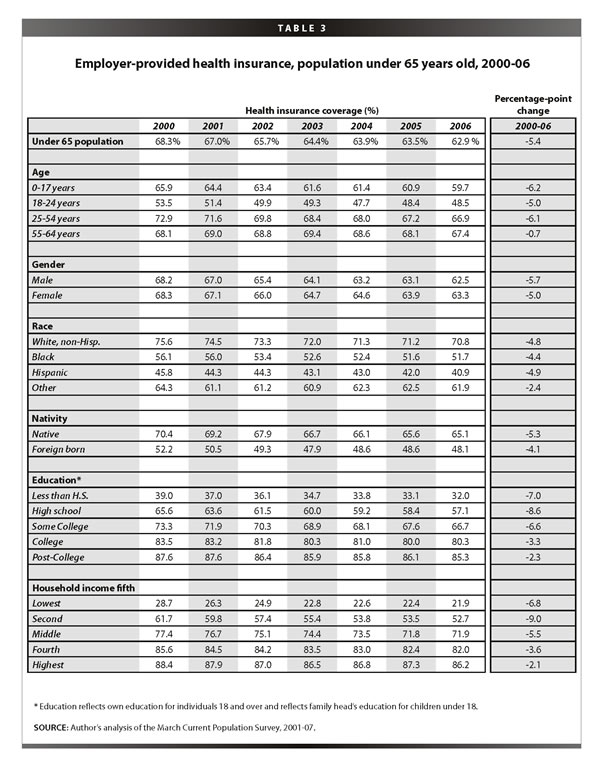
These declines in coverage occurred across all lines: by age, sex, race, education, and household income level. Some people, however, were more hurt than others by the declines. Those with only a high school education and those in the second-to-lowest household income quintile continue to be the hardest hit in the last five years. High school graduates were not only less likely than college graduates to have employer-provided insurance (57.1% vs. 80.3%), but they experienced declines in coverage twice as large (8.6 vs. 3.3 percentage-point drops).4
Health insurance coverage rates were also dramatically different by age, race, and ethnicity. Children under 18, adults 18-24 years old, and adults 25-54 years old experienced significant declines in employer-provided health coverage of 6.2, 5.0, and 6.1 percentage points, respectively. The lack of losses in employer-provided coverage for older Americans may be attributed to their increased employment-to-population ratios during this period. In 2006, 70.8% of whites had employer-provided coverage as compared to 51.7% of blacks and 40.9% of Hispanics. However, each of these groups experienced declines in coverage in excess of 4 percentage points.
Nativity also has a significant impact on the likelihood of having employer-provided health insurance: 65.1% of
natives had coverage in 2006 as compared to 48.1% of those who were foreign born. However, the decline in coverage was pervasive across both groups and the larger fall occurred among the native-born (5.3 vs. 4.1 percentage point drop).
The lowest rates of employer-provided coverage occurred within households with the lowest incomes. Only about one in five individuals in household in the bottom 20% of the income scale had employer-provided health insurance, whereas more than four in five individuals in households at the highest 20% of earners had such coverage (Figure A ). Individuals in households in the second quintile saw the largest declines in coverage. Their coverage rates fell 9.0 percentage points, from 61.7% in 2000 to 52.7% in 2006, which translates into nearly 3 million fewer Americans in the second quintile with employer-provided coverage.
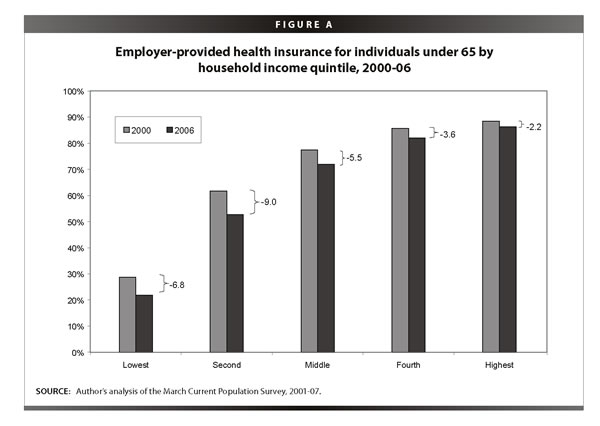
While disparities in health insurance coverage by income have grown over time, no group is immune to the losses in employment-based coverage. In fact, it was individuals in the highest fifth of family income, who experienced the largest declines in coverage over the last year, a drop of 1.1 percentage points—equal to the amount it fell in the previous five years combined.
Declining coverage for workers
Employer-provided health insurance
The percent of workers with employer-provided health insurance coverage fell from 2005 to 2006, continuing the uninterrupted decline that began in 2000. As shown in Table 4, 70.8% of workers in 2006 had employer-provided health insurance either from their own or their spouse’s job, down from 71.2% the year before and down a total of 4.0 percentage points since 2000. Nearly 1.9 million fewer workers had employer-provided health insurance in 2006 than in 2000.
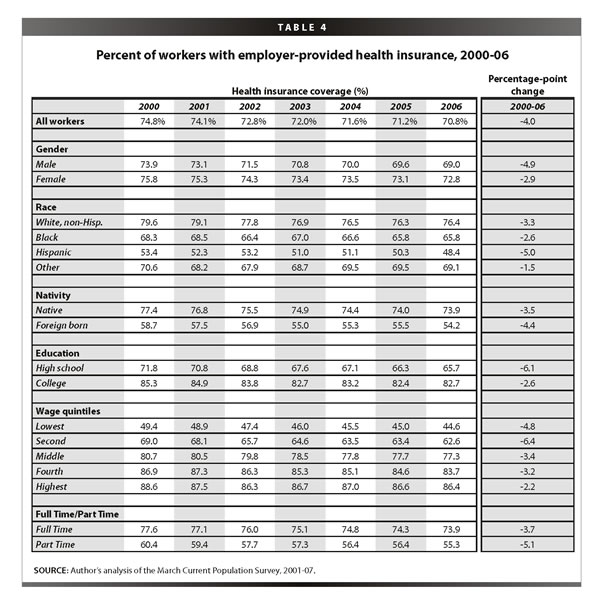
The loss of coverage was greater for men than women, as the coverage rate for working men with employer-provided insurance fell 4.9 percentage points compared to 2.9 points for women workers. Hispanic workers have the lowest coverage rates and experienced the largest declines from 2000 to 2006. Similarly, foreign born workers had significantly lower coverage rates than natives (54.2% vs. 73.9%) and experienced greater declines in coverage over the last year and the entire period.
About two-thirds (65.7%) of workers with a high school education were covered in 2006, whereas 82.7% of college-educated workers had employer-provided health coverage. This disparity reflects the fact that higher-skilled workers are likely to have higher-quality jobs that offer health benefits. That said, even college graduates have not been insulated from the decline in employer-provided health insurance. Nonetheless, workers with only a high school education still fared worse than those with a college degree (a decline of 6.1 vs. 2.6 percentage points, respectively).
Workers earning lower hourly wages are significantly less likely to have employer-provided health coverage than those earning higher wages; however, even those in the highest wage quintile were subjected to losses in coverage. Full-time workers are more likely to have employer-provided health insurance than part-time workers (73.9% vs. 55.3%). At the same time, over one-fourth of full-time workers, or about 32 million full-time workers, are not receiving employer-provided health insurance. These numbers have increase consistently over the last six years, and are up 5.5 million since 2000.
An important group of workers to examine more closely are workers who are significantly attached to the private sector labor force, defined as those who work in the private sector at least 20 hours per week and 26 weeks per year. While flat over the last year, the coverage rates for these workers have fallen since 2000 (Table 5 ). Only 55.0% of these steady workers receive health insurance from their own employer, down almost 4 percentage points since 2000.
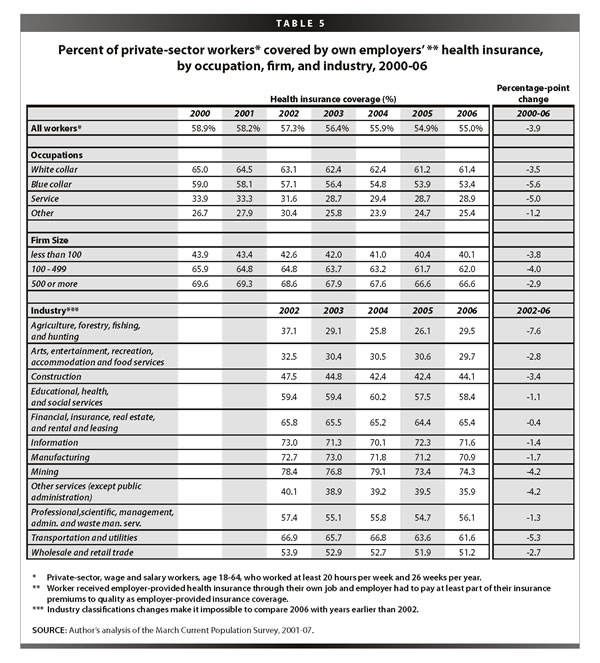
White collar, blue collar, and service sector workers experienced declines in coverage. Service workers are insured at half the rate of white collar workers (28.9% vs. 61.4%), but blue-collar workers had the largest drop in coverage of 5.6 percentage points. Workers in larger firms are more likely to have employer-provided health insurance from their employer than workers in smaller firms. Only 40.1% of workers in small firms (firms of less than 100 employees) had employer-provided health insurance compared to 62.0% in firms with 100-499 employees and 66.6% in firms with greater than 500 employees. Workers in firms of all sizes lost coverage, but those in firms with less than 500 employees had the greatest declines since 2000.
Coverage rates in 2006 differ dramatically by the worker’s major industrial sector, however, all experienced declines since 2002.5 Workers in the two largest sectors—wholesale and retail trade and education, health, and social services—have coverage rates in 2006 of 51.8% and 58.4%, respectively. Manufacturing, another large sector, had a coverage rate of 70.9% in 2006, a decline of 1.7 percentage points from 2002. Manufacturing jobs have been falling as a share of total private sector jobs, as total employment in this sector declined 7% over this period. These high-quality jobs, as defined by a greater likelihood of providing health benefits, are declining both because fewer workers in the industry are getting benefits and because there are fewer workers in the industry than in previous years.
Uninsured workers
While the predominant form of health insurance for workers is through the workplace, some are eligible for Medicaid or Medicare and others may choose to purchase insurance in the private market. To best understand the growing insecurity of many working families, it is important to examine
the growth in the uninsured workforce. In 2006, 18.7% workers age 18-64 were uninsured (Table 6). These 27.6 million uninsured workers make up about 60% of the total uninsured population. Since 2000, the number of uninsured workers has grown an additional 2.8 percentage points (4.9 million workers).
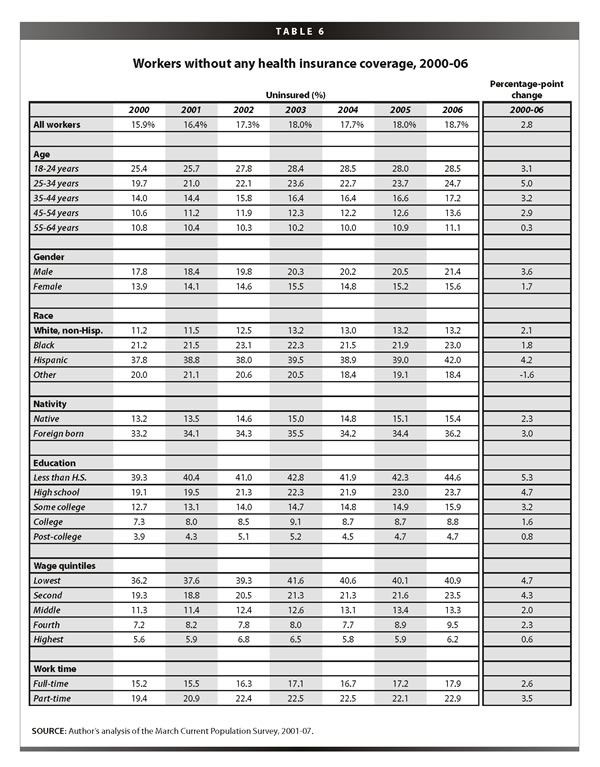
Male workers are more likely to be uninsured and experienced a twice as large increase in their uninsured rate since 2000 than female workers. Hispanic workers have the highest uninsured rate of any other race/ethnicity, in fact, nearly twice as high at 42.0% (Table 6). Foreign-born workers are disproportionately more likely to be uninsured. They make up only 15.7% of the workforce, but 30.4% of uninsured workers (Table 7 ).
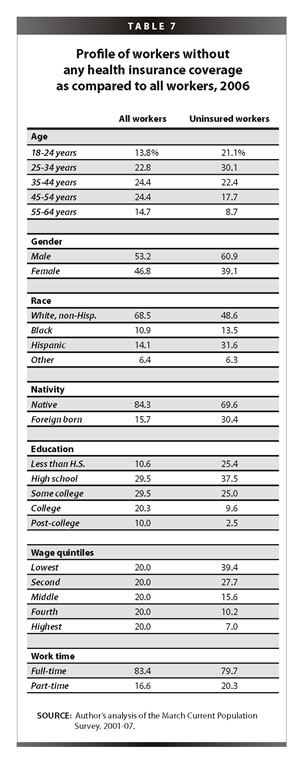
Uninsured workers tend to be younger. Nearly 29% of young workers (18-24 years old) are uninsured as compared to about 11% of workers age 55-64. The groups of young and older workers represent about 14% and 15% of the workforce respectively, but 21% and 9% of the uninsured workforce, respectively (Table 7).
Uninsurance among workers falls consistently with education, from 44.6% for those with less than a high school degree to 4.7% for those with graduate education. That is nearly a ten-fold increase in the uninsured rate between these two education groups. This disparity has increased over the last six years as the lowest educated group increased their percent uninsured by 5.3 percentage points compared to only a 0.8 percentage point increase for the highest educated group.
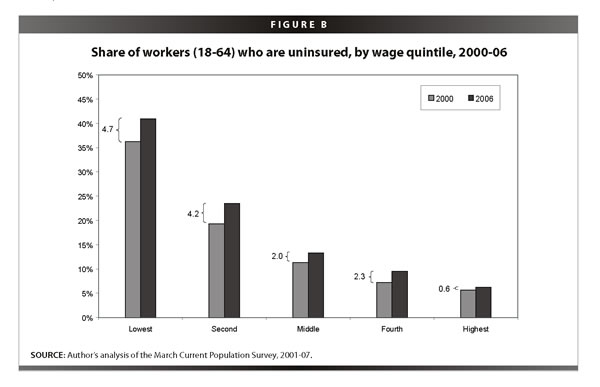
Uninsurance declines as wages rise (Figure B ). While 40.9% of workers in the lowest wage quintile were uninsured in 2006, only 6.2% of workers in the highest quintile were uninsured. Nearly 40% of uninsured workers fall in the lowest wage quintile, while a disproportionately small number of uninsured workers are middle or high income. Workers’ rates of uninsurance from 2000 to 2006 also declined as income rises. Workers in the lowest wage quintile experience an increase about eight times the amount experienced by those in the highest wage quintile (4.7 vs. 0.6 percentage points). Full-time workers have lower rates of uninsurance than part-timers, however, both declined significant amounts in the last six years.
Declining coverage for children
Most children (59.7%) receive health insurance through their parent’s job, however, 3.4 million fewer children had coverage in 2006 than in 2000. The rate of employer-provided health insurance for children fell 6.2 percentage points between 2000 and 2006. This drop occurred across all socio-economics group, as shown in Table 8.
While white, non-Hispanic children are the most likely to receive employment-based coverage, their coverage rates fell the greatest of any race or ethnic group. Similarly, native-born children have much higher coverage rates than foreign born (60.6% vs. 40.6%), but their coverage rates fell more dramatically from 2000 to 2006 than foreign-born children.
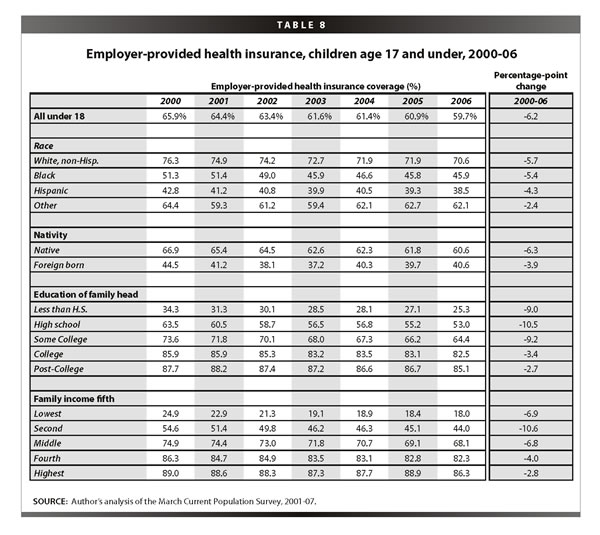
The results under the education heading assign each child the education level of their family head, as children under 18 rarely complete their education by that time. Children with parents of lower education attainment fare much worse than those with college or advanced degrees. Only 53.0% of children with high-school-educated parents have employer-provided health insurance as compared to 82.5% of children with college-educated parents. The declines in coverage from 2000 to 2006 were more than three times greater for the former group as well.
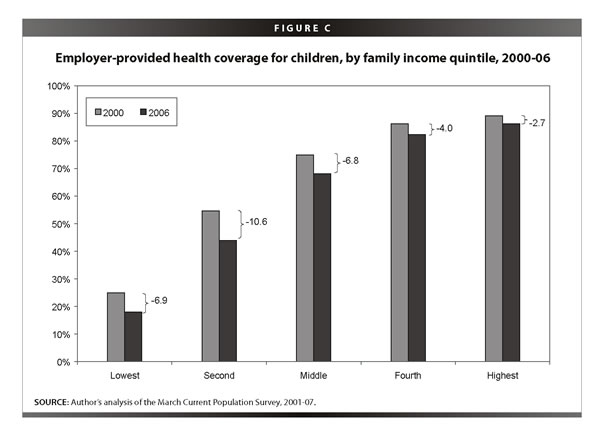
The unequal distribution of employer-provided health care is particularly revealing when children are ranked by their family’s income (Figure C ). In 2006, only 18.0% of children in the lowest income quintile were found to have employer-provided health insurance, compared with 86.3% of the children in the highest income quintile. In other words, children whose household incomes were in the top 20% were nearly five times more likely to have employer-provided health insurance than children in the lowest 20% of household income. This disparity has only been exacerbated over the past five years: the drop in coverage for those in the lowest income quintile was 6.9 percentage points, while the drop for those in the highest quintile was only 2.8 percentage points. The group hurt the worst, however, was children in the second lowest quintile; their coverage rates declined by 10.6 percentage points, from 54.6% to 44.0%.
The number of uninsured children rose 611,000 from 2005 to 2006, to a total of over 8.6 million uninsured children. The percent of uninsured children rose from 10.9% to 11.7%, a statistically significant increase. This is the second year in a row that the number and rate of uninsured children has grown. This unfortunate trend was caused by the confluence of two events. First, there has been a significant drop in the number of children covered by employer-provided health insurance. In the last two years, over 1 million fewer children had employer-provided health insurance. Second, there was a significant reversal in trend in the number of children insured by Medicaid or SCHIP in 2005 and public coverage of children has just returned to the level it was two years ago. In previous years, the strength of government programs aimed at children kept many from falling into the ranks of the uninsured, keeping them better insulated from the losses in employer-provided coverage. The safety net does not appear to be catching as many children as in the past.
State coverage: an analysis of California
While national analyses are interesting, much change has happened with health insurance at the state level. Massachusetts has enacted universal coverage legislation and other states are considering similar measures. California is a useful state to examine as a microcosm of the United States as a whole. It is representative with its large population, but has particular challenges to overcome, including low rates of insurance and high levels of immigration. California was one of the first states to grapple with universal coverage, has conducted recent innovations in cities, and has considered policies to expand coverage from both republican and democratic politicians in the past year. This portion of the report is dedicated to examining recent trends in insurance for California.
Coverage among the under-65 population in California
Nearly 18 million non-elderly Californians had employer-provided health insurance coverage in 2006, higher than any other state. However, this number is mostly a byproduct of the sheer size of the state population and masks the fact that California has one of the lowest coverage rates in the country. Its rate of 55.5% in 2006 ranks below 45 states and the District of Columbia. As shown in Table 9, the decline in coverage from 2000-06 parallels the average declines across the country (5.3 vs. 5.4 percentage points).
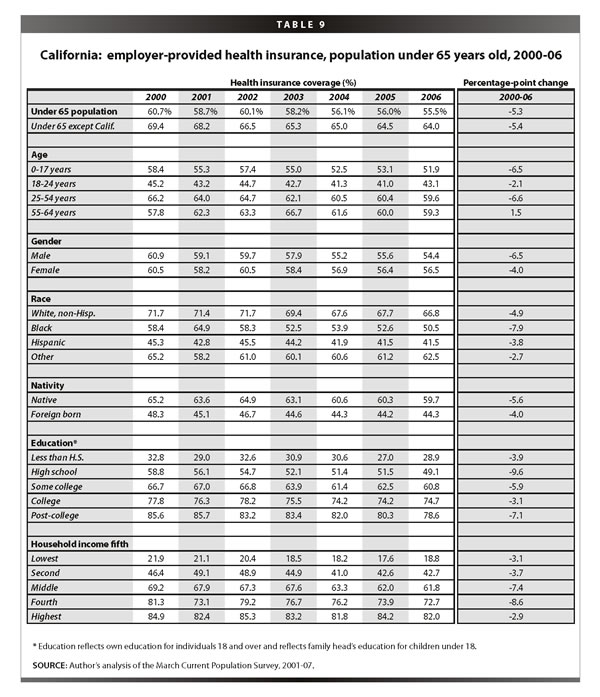
The lowest rates are among young adults, but the largest losses were among children and those 25-54 years old. Greater losses in coverage among men from 2000 to 2006 caused the percent of men covered to fall below the rate of women. Trends by race and nativity track closely those across the United States; ho
wever, trends by education and household income tell a different story. While Californians with lower education and lower income have significantly lower rates of coverage than those at the top, even those who traditionally have been shielded from declines in coverage experienced large declines. The rates of coverage for those with post-college education fell 7.1 percentage points. The middle fifth (40-60% of income) and the upper-middle fifth (60-80% of income) fell 7.4 and 8.6 percentage points, respectively.
Employment-based coverage for workers and uninsured workers in California
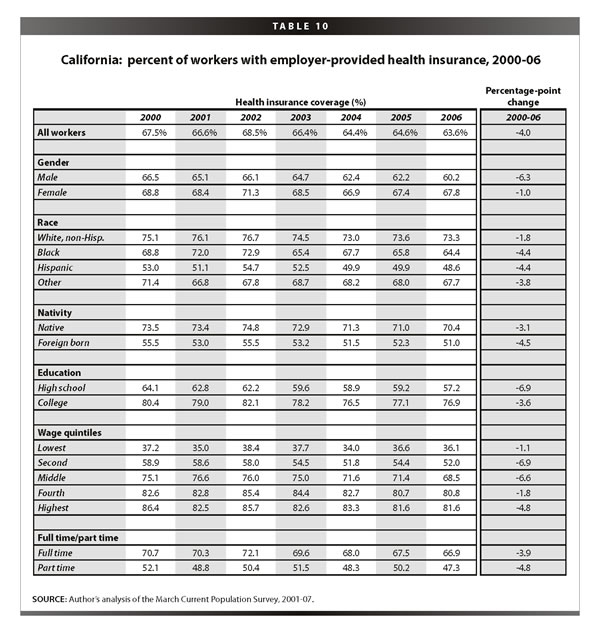
Similar to the population as a whole, employer-provided health insurance among workers was lower in California than the United States (63.6% vs. 70.8%), but the percentage point change from 2000 to 2006 was the same (see Table 10). Working men felt the losses most dramatically, with declines of 6.3 percentage points compared with 1.0 percentage points for working women. Similarly, foreign-born workers had lower rates of coverage and larger declines in coverage than native-born workers. Workers with more education and higher income have significantly higher rates of coverage, however, the losses in coverage were felt across the distribution. Even workers in the highest wage fifth and full-time workers experienced declines in coverage from 2000 to 2006.
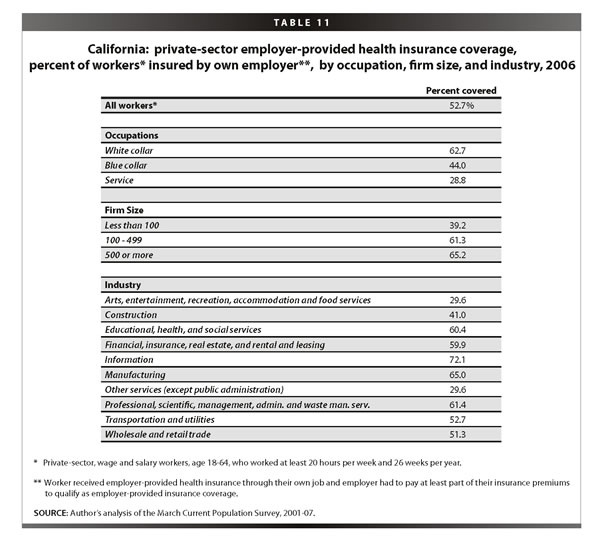
While sample size constraints restrict comparison of strongly attached workers across years, Table 11 offers important information about the distribution of coverage by occupation, firm size, and industry in California. Just over half of all workers with strong attachments to the labor force have insurance through their own job. White-collar workers are most likely to have such coverage (62.7%) as compared to blue-collar workers (44.0%) and service sector workers (28.8%). Workers in larger firms have much higher coverage rates than those in small firms. Workers in the information sector and in manufacturing have the highest rates of coverage, in fact, rates twice as high as those working in arts, entertainment, recreation, accommodation and food services, and other services.
Children’s insurance coverage in California
The majority of losses in employment-based coverage in California fell among the children. Over 600,000 fewer children had employer-provided health insurance in 2006 than in 2000. As shown in Table 12, just over half (51.9%) of all California children had this insurance compared with 59.7% nationally.
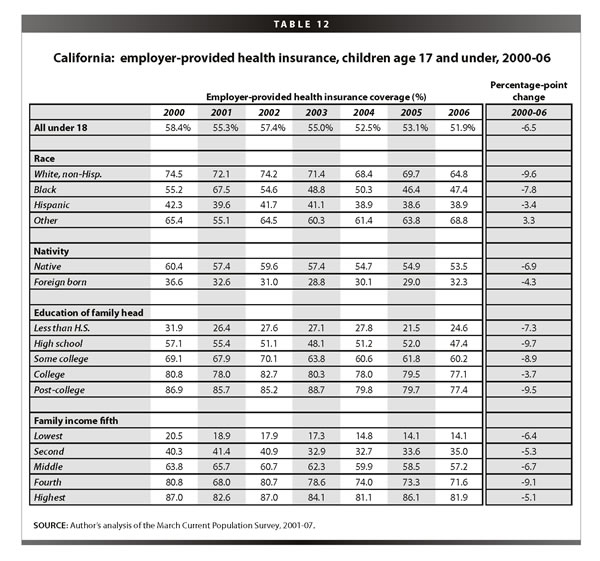
Children across socio-economic categories have experienced declines in coverage. White, non-Hispanic children had 9.6 percentage point declines in coverage from 2000 to 2006, larger than any other group. Native-born kids, while enjoying higher rates of coverage than the foreign born, had faster falling coverage rates (6.9 vs. 4.3 percentage points). Education and income have typically insulated families from losses in coverage, but this did not occur during this period. Higher education and income are related to much higher rates of coverage, but the losses occurred across the spectrum.
These declines in employment-based coverage have significantly contributed to large numbers of uninsured children, over 1.2 million uninsured kids in 2006. Uninsured children have a significantly negative impact on the community, business, and the public insurance system (Gould 2007). More uninsured children make a strong case for expansion of SCHIP and other public insurance programs.
Coverage across the states
While the majority of states experienced significant declines in employer-provided coverage for the under-65 population between the 2000-01 and 2005-06 periods, the level and extent of coverage loss varied by state, as shown in Table 13. The states with the highest employer-provided coverage rates in the merged 2005-06 years were New Hampshire (75.6%), Connecticut (72.3%), and New Jersey (72.1%). The lowest coverage rates were found in New Mexico (52.9%) and Texas (54.6%). Thirty-seven states experienced significant losses in coverage. Utah, South Carolina, Maryland, and Georgia experienced losses in excess of 7 percentage points. No state experienced a significant increase in their coverage rate.
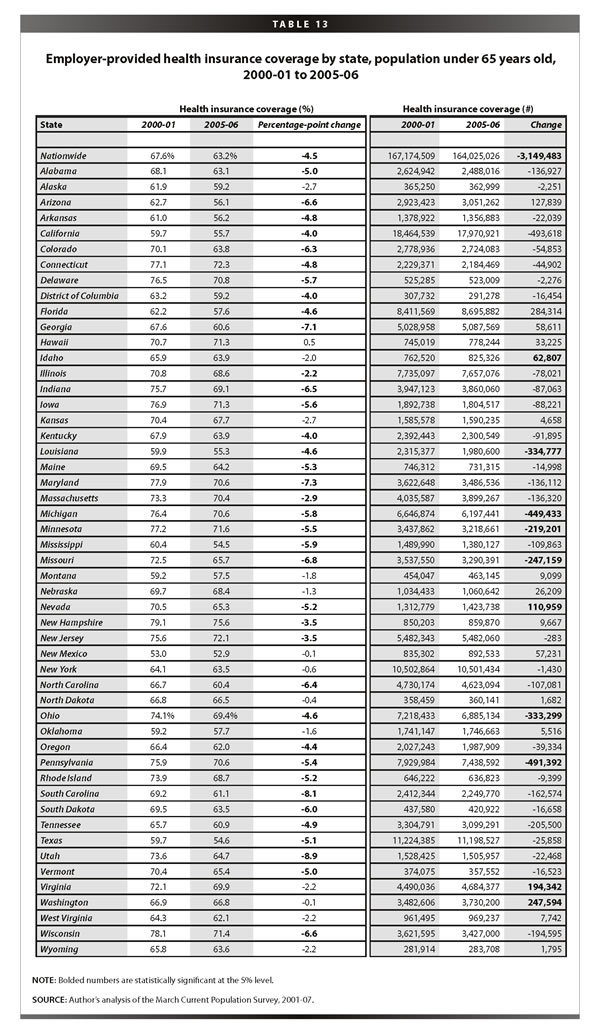
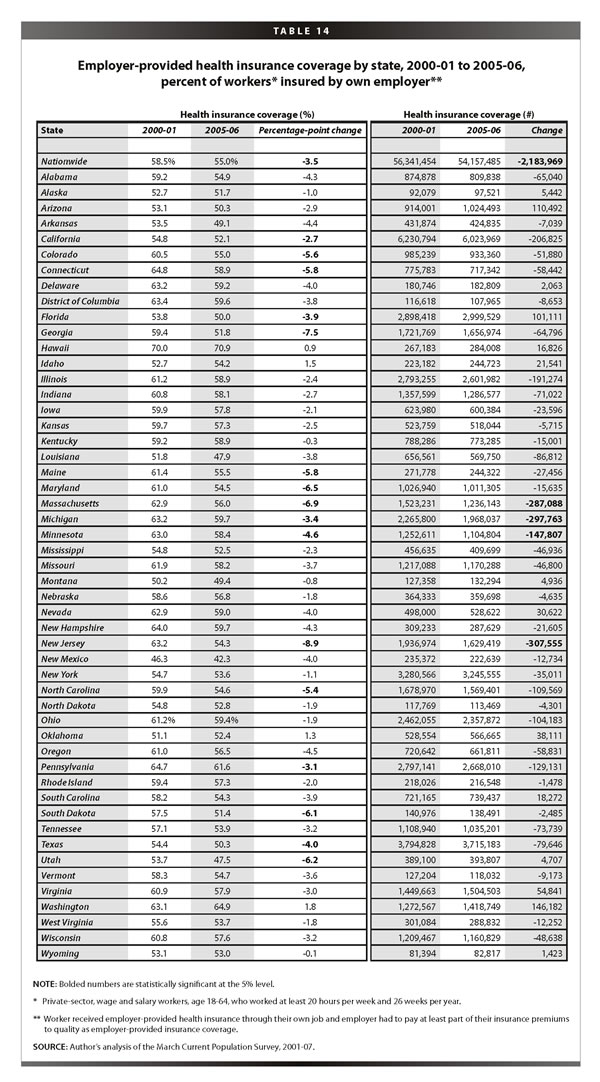
Table 14 displays the coverage levels and rates for workers who are significantly attached to the private-sector labor force and receive employer-provided coverage from their own job. The state with the highest rate of employer-provided coverage among workers was Hawaii, with a coverage rate in 2005-06 of 70.9%, far exceeding the national average of 55.0%. This is likely because Hawaii has a government mandate requiring employers to provide health insurance to their workers who work at least 20 hours per week. The largest declines in coverage for workers between 2000-01 and 2005-06 were in New Jersey and Georgia with declines of 8.9 and 7.5 percentage points, respectively. As with the under-65 population, there is no state with a statistically significant increase in its coverage rate for workers.
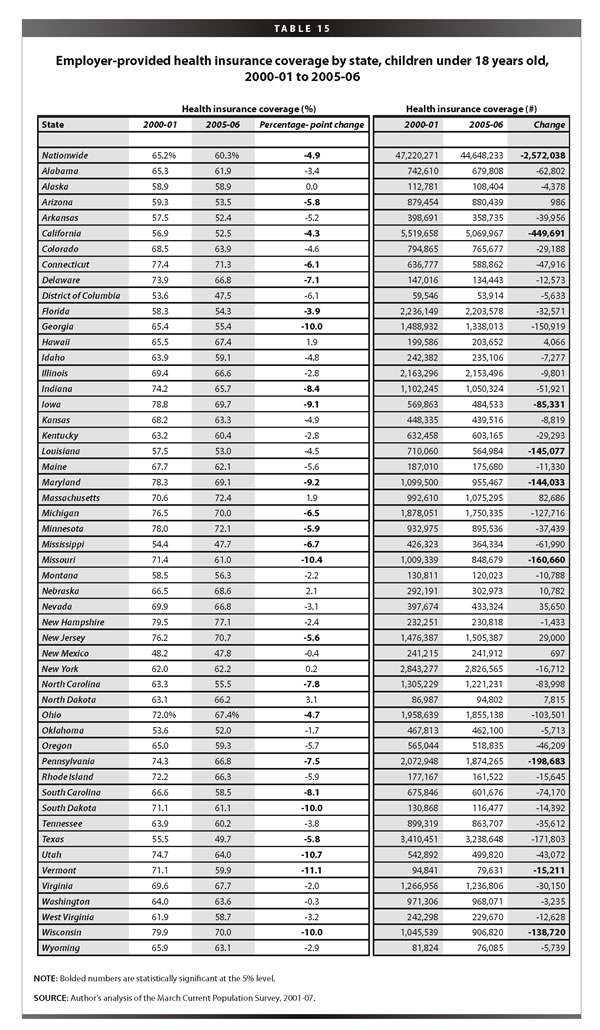
State-by-state employer-provided coverage levels and rates for children are displayed in Table 15. The highest rates of employer-provided coverage for children in 2005-06 were in New Hampshire (77.1%), Massachusetts (72.4%), and Minnesota (72.1%). At the same time, the District of Columbia, Mississippi, New Mexico, and Texas covered less than half their children with employer-provided health insurance. From 2000-01 to 2005-06, 23 states experienced significant losses in coverage while losses in Wisconsin, Vermont, Utah, Missouri, and Georgia exceeded 10 percentage points each. Again, no state had a statistically significant increase in children’s coverage from 2000-01 to 2005-06.
Conclusion
Social insurance is intended to insulate people from negative shocks such as job loss, illness, or natural disaster. Public insurance is intended to provide a safety net to people who have limited access to private insurance markets. Clearly, there are many Americans who fall through the growing gulf between employer-provided coverage and government health programs. A universal system, one that provides a minimum standard of care to everyone, would provide Americans with access to the type of health care appropriate for the most prosperous nation in the world. Taking insurance out of the job market and into the public sector has the potential to provide a stronger safety net, particularly during times of weak labor growth. More Americans would have steadier insurance access and increase their ability to get regular medical care.
From 2000 to 2006, the United States saw a substantial rise in the number of uninsured people. A continued decline in those with employer-provided health insurance, along with a weakening of the health insurance safety net, will undoubtedly leave more Americans without coverage and access to adequate health care.
— The author thanks Jin Dai and James Lin for their research assistance and Liana Fox for her valuable state-level contributions to this Briefing Paper. EPI thanks the California Endowment, the Ford Foundation, the Charles Stewart Mott Foundation, the Open Society Instit
ute, the Bernard and Audre Rapoport Foundation, and the Rockefeller Foundation for their support of this research.
Endnotes
1. Opponents of SCHIP expansion argue that the availability of a public insurance option leads parents to voluntarily drop private coverage and shift their children’s coverage to the public sector. As shown in an EPI Economic Snapshot (http://www.epi.org/content.cfm/webfeatures_snapshots_20070912), research shows very little of such “crowding out” actually occurs. The large majority of SCHIP recipients—86%—were either not covered six months before entering SCHIP or had lost private coverage within six months prior to enrolling.
2. The Economic Policy Institute, as part of its Agenda for Shared Pr osperity, has put forth one such solution. See http://www.sharedprosperity.org/bp180.html for details of this plan.
3. The over-65 population is not helpful to this analysis because of their nearly 100% coverage rates through Medicare.
4. In this analysis, children under 18 are assigned the education level of their family head.
5. Insurance by industrial sectors can only be accurately compared back to 2002 due to changes in industry classifications in the data.
References
Congressional Budget Office. 2007. CBO’s Estimate of Changes in SCHIP and Medicaid Enrollment of Children Under the House Amendments to the Senate Amendments to H.R. 976, the Children’s Health Insurance Program Reauthorization Act of 2007. Washington, D.C.: CBO. September 24.
Gould, Elise. 2007. California Kids Lose Employment-Based Coverage: The Impact on the Community, Business, and the Public Insurance System. Economic Policy Institute Briefing Paper #199. Washington, D.C.: EPI.
Himmelstein, David U., Elizabeth Warren, Deborah Thorne, and Steffie Woolhandler. 2005. Illness and Injury as Contributors to Bankruptcy. Health Affairs Web Exclusive.
Kaiser Family Foundation and The Health Research and Educational Trust. 2007. Employer Health Benefits 2007: Annual Survey. Menlo Park, Calif.: Kaiser Family Foundation.
