Unemployment Rate Continues To Be Elevated Across the Board
The jobs numbers today, along with a closer look at unemployment rates by demographic groups, point to considerable slack in the labor market across the board. A couple weeks back, I examined real (inflation adjusted) wages across the wage distribution. One of my findings was that real wages fell for all education groups between the first half of 2013 and the first half of 2014. As you can see in the figure below, real hourly wages fell even for those with a college or advanced degree.
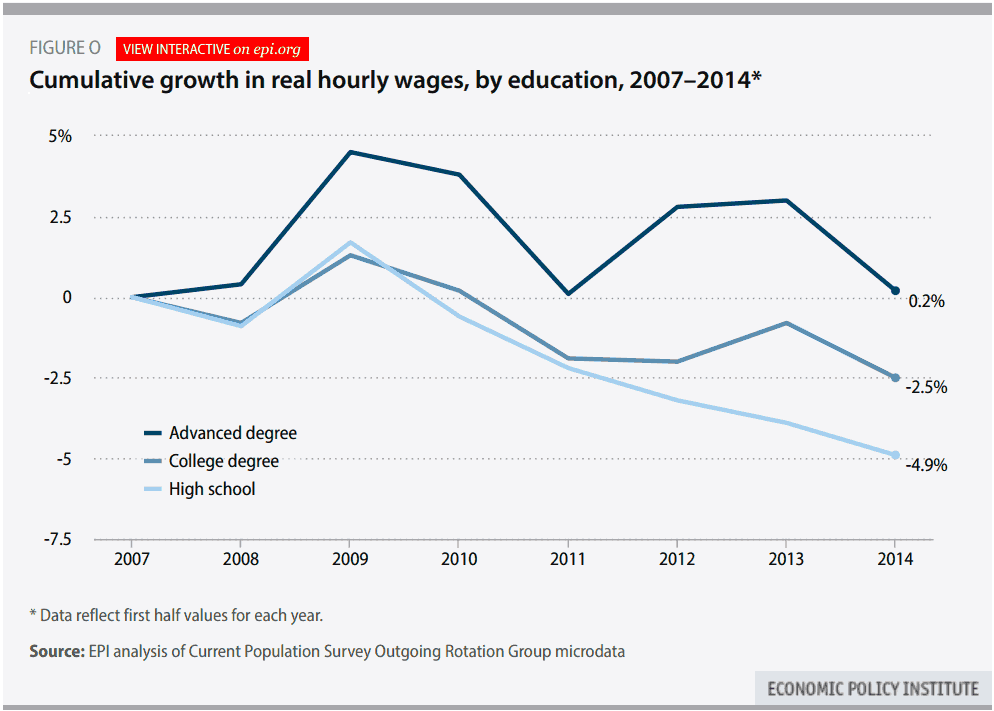
And, when we look at these declining real wages hand in hand with the unemployment rates of those with a college or advanced degree, it is obvious that the existence of any sort of skill mismatch is a myth.
The table below shows the August unemployment rate, the unemployment rate in 2007, and the ratio of the two, for a variety of demographic characteristics and by occupation and industry. While there is considerable variation in unemployment rate across groups, the unemployment rate is substantially higher now than it was before the recession started for all groups. The unemployment rate is between 1.2 and 1.6 percent higher now than it was seven year ago for all age, education, occupation, industry, gender, and racial and ethnic groups. Elevated unemployment across the board, like we see today, means that the weak labor market is due to a lack of demand for goods and services that would require employers to significantly ramp up hiring—it’s not because workers lack the right skills or education for the occupations or industries where jobs are available.
Notably, tied for the highest ratio, or most elevated unemployment rate compared to the 2007 rate, was for workers with a bachelor’s and/or advanced degree. While their overall unemployment rate is among the lowest, it is still quite elevated. It’s no surprise then that even these most credentialed workers are unable to bid up their wages in this economy. And, again, it’s provides further evidence that now is not the time for the Federal Reserve Board to hit the brakes on economic growth. At 2.1 percent annual nominal wage growth, we are far from the Fed’s wage growth target. Right now we should be using all the tools at our disposal to spur economic growth.
Unemployment rate of various demographic groups, 2007 and today
| 2007 | August 2014 | Ratio | |
|---|---|---|---|
| All | 4.6 | 6.1 | 1.3 |
| Male | 4.7 | 6.2 | 1.3 |
| Female | 4.5 | 6.1 | 1.4 |
| White | 4.1 | 5.3 | 1.3 |
| Black | 8.3 | 11.4 | 1.4 |
| Hispanic | 5.6 | 7.5 | 1.3 |
| Age 16–24 | 10.5 | 13.0 | 1.2 |
| Age 25–54 | 3.7 | 5.3 | 1.4 |
| Age 55+ | 3.1 | 4.6 | 1.5 |
| Workers age 25 and older | |||
| High school | 4.4 | 6.2 | 1.4 |
| Bachelor’s and advanced degree | 2.0 | 3.2 | 1.6 |
| Workers under age 25, not enrolled in further schooling | |||
| High school degree | 12.0 | 17.3* | 1.4 |
| Bachelor’s and advanced degree | 5.4 | 7.4* | 1.4 |
| Occupation | |||
| Management, professional, and related occupations | 2.1 | 3.2* | 1.5 |
| Service occupations | 5.9 | 7.6* | 1.3 |
| Sales and office occupations | 4.3 | 6.5* | 1.5 |
| Construction and extraction occupations | 7.6 | 10.5* | 1.4 |
| Installation, maintenance, and repair occupations | 3.4 | 4.8* | 1.4 |
| Production, transportation, and material moving occupations | 5.8 | 8.1* | 1.4 |
| Industry | |||
| Construction | 7.4 | 9.6* | 1.3 |
| Manufacturing | 4.3 | 5.5* | 1.3 |
| Wholesale and retail trade | 4.7 | 6.6* | 1.4 |
| Transportation and utilities | 3.9 | 6.2* | 1.6 |
| Information | 3.6 | 5.6* | 1.6 |
| Financial activities | 3.0 | 4.2* | 1.4 |
| Professional and business services | 5.3 | 7.3* | 1.4 |
| Education and health services | 3.0 | 4.3* | 1.4 |
| Leisure and hospitality | 7.4 | 8.9* | 1.2 |
* This is a 12-month average (September 2013–August 2014), since this series is not seasonally adjusted.
Source: Author's analysis of the Current Population Survey public data series
Enjoyed this post?
Sign up for EPI's newsletter so you never miss our research and insights on ways to make the economy work better for everyone.