Top 1 Percent Receive Record High Share of Total U.S. Income
The United States has experienced increasing economic inequality since the late 1970s. New data released this week confirm that the Great Recession was only a blip on the road toward growing income inequality. Emmanuel Saez and Thomas Piketty updated their now-famous data on cash, market-based income, allowing one to track trends in inequality in the United States between 1913 through 2012.
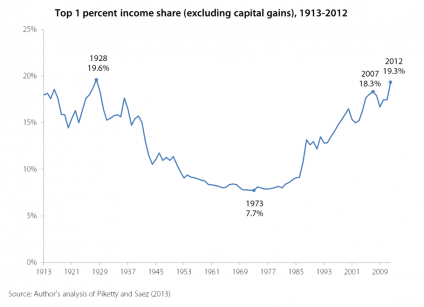
As illustrated in the graph below, the share of income going to the top 1 percent has surpassed its 2007 peak of 18.3 percent and is now 19.3 percent—the highest share since 1928.
At the same time, the Piketty and Saez data show that the Great Recession has battered incomes for the bottom 90 percent so badly that they are now back to the same levels that prevailed in 1966.
Importantly, the Piketty and Saez data show clearly that it hasn’t always been this way. In the decades following 1928, income inequality declined rapidly. Between 1948 and 1979, the top 1 percent claimed less than 10 percent of total income, on average, and income growth was essentially shared proportionately.
Since 1979, the top 1 percent’s take has soared. We have argued that this shouldn’t be a huge shock – since then policies have increasingly been hijacked by those with the most economic power to tilt a larger share of economic rewards their way. Erecting barriers to workers wanting to form unions, allowing the minimum wage to get battered by inflation for decades at a time, dismantling regulations that kept the financial sector in check, writing the rules governing globalization to insure that rank-and-file workers were exposed to global competition but owners of capital were largely shielded from it, and shifting macroeconomic priorities away from ensuring very low unemployment and towards guaranteeing very low inflation all predictably robbed bargaining power from low and moderate wage workers.
Further, while almost nobody would defend these policies on the grounds that they would increase equality, they have been defended on the grounds that they are good for overall economic growth. So, the claim was that while the share of income claimed by the bottom 90 percent might shrink, their actual incomes would grow faster because of the growth bonanza unleashed by these policy changes. But average growth slowed in the last few decades, even as inequality widened. Further, economic literature (surveyed in a recent paper here) finds that there is no real case behind the claim that increasing the share of the top 1 percent helps overall growth at all. So, if the top 1 percent increases their share and overall growth is not boosted by this shift, this simply means there is less money left for everyone else. This is a really important point—those worried about inequality do not have to prove that it has hurt overall economic growth. All we have to show is that it has not demonstrably helped it. As long as this is the case, rising inequality means less money for low and moderate income households, period.
How much less money? Check out this calculator. For more on the package of policies that have led to this rise in inequality, check out inequality.is.
Enjoyed this post?
Sign up for EPI's newsletter so you never miss our research and insights on ways to make the economy work better for everyone.