The labor market still recovering: We should let it
The Job Openings and Labor Turnover Survey (JOLTS) report released today by the Bureau of Labor Statistics shows signs of a continued slow recovery. Job openings fell slightly to 5.4 million, and the quits rate remained, stubbornly, at 1.9 percent, where it has been for most of the last year. Along with last Friday’s jobs report, today’s report provides more evidence of a recovering but still weak economy. While most indicators have been trending in the right direction, nominal wage growth and the prime-age employment-to-population ratio remain far outside of target ranges, and provide ample evidence that the economy has a way to go before reaching full employment.
In October, there were 1.5 unemployed workers for every job opening, a slight tick up from last month. That means they for every 15 jobs, there are five potential workers who won’t be able to find a job no matter how hard they look. And the job-seekers-to-job-openings ratio is higher among certain sectors. Notably, there are still 45 unemployed construction workers for every 10 job openings in construction.
The sluggish quits rate is particularly troubling. At 1.9 percent, the quits rate was still 9.2 percent lower than it was in 2007, before the recession began. This is evidence that workers are stuck in jobs that they would leave if they could. A larger number of people voluntarily quitting their jobs would indicate a strong labor market—one in which workers are able to leave jobs that are not right for them and find new ones. Hopefully we will see a return to pre-recession levels of voluntary quits, but given that the rate has stayed flat, we are obviously not there yet.
Hires, quits, and layoff rates, 2000-2015
| Month | Hires rate | Layoffs rate | Quits rate |
|---|---|---|---|
| Dec-2000 | 4.100000 | 1.400000 | 2.300000 |
| Jan-2001 | 4.400000 | 1.600000 | 2.600000 |
| Feb-2001 | 4.100000 | 1.400000 | 2.500000 |
| Mar-2001 | 4.200000 | 1.600000 | 2.400000 |
| Apr-2001 | 4.000000 | 1.500000 | 2.400000 |
| May-2001 | 4.000000 | 1.500000 | 2.400000 |
| Jun-2001 | 3.800000 | 1.500000 | 2.300000 |
| Jul-2001 | 3.900000 | 1.500000 | 2.200000 |
| Aug-2001 | 3.800000 | 1.400000 | 2.100000 |
| Sep-2001 | 3.800000 | 1.600000 | 2.100000 |
| Oct-2001 | 3.800000 | 1.700000 | 2.200000 |
| Nov-2001 | 3.700000 | 1.600000 | 2.000000 |
| Dec-2001 | 3.700000 | 1.400000 | 2.000000 |
| Jan-2002 | 3.700000 | 1.400000 | 2.200000 |
| Feb-2002 | 3.700000 | 1.500000 | 2.000000 |
| Mar-2002 | 3.500000 | 1.400000 | 1.900000 |
| Apr-2002 | 3.800000 | 1.500000 | 2.100000 |
| May-2002 | 3.800000 | 1.500000 | 2.100000 |
| Jun-2002 | 3.700000 | 1.400000 | 2.000000 |
| Jul-2002 | 3.800000 | 1.500000 | 2.100000 |
| Aug-2002 | 3.700000 | 1.400000 | 2.000000 |
| Sep-2002 | 3.700000 | 1.400000 | 2.000000 |
| Oct-2002 | 3.700000 | 1.400000 | 2.000000 |
| Nov-2002 | 3.800000 | 1.500000 | 1.900000 |
| Dec-2002 | 3.800000 | 1.500000 | 2.000000 |
| Jan-2003 | 3.800000 | 1.500000 | 1.900000 |
| Feb-2003 | 3.600000 | 1.500000 | 1.900000 |
| Mar-2003 | 3.400000 | 1.400000 | 1.900000 |
| Apr-2003 | 3.600000 | 1.600000 | 1.800000 |
| May-2003 | 3.500000 | 1.500000 | 1.800000 |
| Jun-2003 | 3.700000 | 1.600000 | 1.800000 |
| Jul-2003 | 3.600000 | 1.600000 | 1.800000 |
| Aug-2003 | 3.600000 | 1.500000 | 1.800000 |
| Sep-2003 | 3.700000 | 1.500000 | 1.900000 |
| Oct-2003 | 3.800000 | 1.400000 | 1.900000 |
| Nov-2003 | 3.600000 | 1.400000 | 1.900000 |
| Dec-2003 | 3.800000 | 1.500000 | 1.900000 |
| Jan-2004 | 3.700000 | 1.500000 | 1.900000 |
| Feb-2004 | 3.600000 | 1.400000 | 1.900000 |
| Mar-2004 | 3.900000 | 1.400000 | 2.000000 |
| Apr-2004 | 3.900000 | 1.500000 | 2.000000 |
| May-2004 | 3.800000 | 1.400000 | 1.900000 |
| Jun-2004 | 3.800000 | 1.400000 | 2.000000 |
| Jul-2004 | 3.700000 | 1.400000 | 2.000000 |
| Aug-2004 | 3.900000 | 1.500000 | 2.000000 |
| Sep-2004 | 3.800000 | 1.400000 | 2.000000 |
| Oct-2004 | 3.900000 | 1.400000 | 2.000000 |
| Nov-2004 | 3.900000 | 1.500000 | 2.100000 |
| Dec-2004 | 4.000000 | 1.500000 | 2.100000 |
| Jan-2005 | 3.900000 | 1.400000 | 2.100000 |
| Feb-2005 | 3.900000 | 1.400000 | 2.000000 |
| Mar-2005 | 3.900000 | 1.500000 | 2.100000 |
| Apr-2005 | 4.000000 | 1.400000 | 2.100000 |
| May-2005 | 3.900000 | 1.400000 | 2.100000 |
| Jun-2005 | 3.900000 | 1.500000 | 2.100000 |
| Jul-2005 | 3.900000 | 1.400000 | 2.000000 |
| Aug-2005 | 4.000000 | 1.400000 | 2.200000 |
| Sep-2005 | 4.000000 | 1.400000 | 2.300000 |
| Oct-2005 | 3.800000 | 1.300000 | 2.200000 |
| Nov-2005 | 3.900000 | 1.200000 | 2.200000 |
| Dec-2005 | 3.700000 | 1.300000 | 2.100000 |
| Jan-2006 | 3.900000 | 1.300000 | 2.100000 |
| Feb-2006 | 3.900000 | 1.300000 | 2.200000 |
| Mar-2006 | 3.900000 | 1.200000 | 2.200000 |
| Apr-2006 | 3.800000 | 1.300000 | 2.100000 |
| May-2006 | 4.000000 | 1.400000 | 2.200000 |
| Jun-2006 | 3.900000 | 1.200000 | 2.200000 |
| Jul-2006 | 3.900000 | 1.300000 | 2.200000 |
| Aug-2006 | 3.800000 | 1.200000 | 2.200000 |
| Sep-2006 | 3.800000 | 1.300000 | 2.100000 |
| Oct-2006 | 3.800000 | 1.300000 | 2.100000 |
| Nov-2006 | 4.000000 | 1.300000 | 2.300000 |
| Dec-2006 | 3.800000 | 1.300000 | 2.200000 |
| Jan-2007 | 3.800000 | 1.200000 | 2.200000 |
| Feb-2007 | 3.800000 | 1.300000 | 2.200000 |
| Mar-2007 | 3.800000 | 1.300000 | 2.200000 |
| Apr-2007 | 3.700000 | 1.300000 | 2.100000 |
| May-2007 | 3.800000 | 1.300000 | 2.200000 |
| Jun-2007 | 3.800000 | 1.300000 | 2.000000 |
| Jul-2007 | 3.700000 | 1.300000 | 2.100000 |
| Aug-2007 | 3.700000 | 1.300000 | 2.100000 |
| Sep-2007 | 3.700000 | 1.500000 | 1.900000 |
| Oct-2007 | 3.800000 | 1.400000 | 2.100000 |
| Nov-2007 | 3.700000 | 1.400000 | 2.000000 |
| Dec-2007 | 3.600000 | 1.300000 | 2.000000 |
| Jan-2008 | 3.500000 | 1.300000 | 2.000000 |
| Feb-2008 | 3.500000 | 1.400000 | 2.000000 |
| Mar-2008 | 3.400000 | 1.300000 | 1.900000 |
| Apr-2008 | 3.500000 | 1.300000 | 2.100000 |
| May-2008 | 3.300000 | 1.300000 | 1.900000 |
| Jun-2008 | 3.500000 | 1.500000 | 1.900000 |
| Jul-2008 | 3.300000 | 1.400000 | 1.800000 |
| Aug-2008 | 3.300000 | 1.600000 | 1.700000 |
| Sep-2008 | 3.100000 | 1.400000 | 1.800000 |
| Oct-2008 | 3.300000 | 1.600000 | 1.800000 |
| Nov-2008 | 2.900000 | 1.600000 | 1.500000 |
| Dec-2008 | 3.200000 | 1.800000 | 1.600000 |
| Jan-2009 | 3.100000 | 1.900000 | 1.500000 |
| Feb-2009 | 3.000000 | 1.900000 | 1.500000 |
| Mar-2009 | 2.800000 | 1.800000 | 1.400000 |
| Apr-2009 | 2.900000 | 2.000000 | 1.300000 |
| May-2009 | 2.800000 | 1.600000 | 1.300000 |
| Jun-2009 | 2.800000 | 1.600000 | 1.300000 |
| Jul-2009 | 2.900000 | 1.700000 | 1.300000 |
| Aug-2009 | 2.900000 | 1.600000 | 1.300000 |
| Sep-2009 | 3.000000 | 1.600000 | 1.300000 |
| Oct-2009 | 2.900000 | 1.500000 | 1.300000 |
| Nov-2009 | 3.100000 | 1.400000 | 1.400000 |
| Dec-2009 | 2.900000 | 1.500000 | 1.300000 |
| Jan-2010 | 3.000000 | 1.400000 | 1.300000 |
| Feb-2010 | 2.900000 | 1.400000 | 1.300000 |
| Mar-2010 | 3.200000 | 1.400000 | 1.400000 |
| Apr-2010 | 3.100000 | 1.300000 | 1.500000 |
| May-2010 | 3.300000 | 1.300000 | 1.400000 |
| Jun-2010 | 3.100000 | 1.500000 | 1.500000 |
| Jul-2010 | 3.200000 | 1.600000 | 1.400000 |
| Aug-2010 | 3.000000 | 1.400000 | 1.400000 |
| Sep-2010 | 3.100000 | 1.400000 | 1.500000 |
| Oct-2010 | 3.100000 | 1.300000 | 1.400000 |
| Nov-2010 | 3.100000 | 1.400000 | 1.400000 |
| Dec-2010 | 3.200000 | 1.400000 | 1.500000 |
| Jan-2011 | 3.000000 | 1.300000 | 1.400000 |
| Feb-2011 | 3.100000 | 1.300000 | 1.400000 |
| Mar-2011 | 3.300000 | 1.300000 | 1.500000 |
| Apr-2011 | 3.200000 | 1.300000 | 1.500000 |
| May-2011 | 3.100000 | 1.300000 | 1.500000 |
| Jun-2011 | 3.300000 | 1.400000 | 1.500000 |
| Jul-2011 | 3.200000 | 1.300000 | 1.500000 |
| Aug-2011 | 3.200000 | 1.300000 | 1.500000 |
| Sep-2011 | 3.300000 | 1.300000 | 1.500000 |
| Oct-2011 | 3.200000 | 1.300000 | 1.500000 |
| Nov-2011 | 3.200000 | 1.300000 | 1.500000 |
| Dec-2011 | 3.200000 | 1.300000 | 1.500000 |
| Jan-2012 | 3.200000 | 1.300000 | 1.500000 |
| Feb-2012 | 3.300000 | 1.300000 | 1.600000 |
| Mar-2012 | 3.300000 | 1.300000 | 1.600000 |
| Apr-2012 | 3.200000 | 1.400000 | 1.600000 |
| May-2012 | 3.300000 | 1.400000 | 1.600000 |
| Jun-2012 | 3.200000 | 1.300000 | 1.600000 |
| Jul-2012 | 3.200000 | 1.200000 | 1.600000 |
| Aug-2012 | 3.300000 | 1.400000 | 1.600000 |
| Sep-2012 | 3.100000 | 1.300000 | 1.400000 |
| Oct-2012 | 3.200000 | 1.300000 | 1.500000 |
| Nov-2012 | 3.300000 | 1.300000 | 1.600000 |
| Dec-2012 | 3.200000 | 1.100000 | 1.600000 |
| Jan-2013 | 3.300000 | 1.200000 | 1.700000 |
| Feb-2013 | 3.400000 | 1.200000 | 1.700000 |
| Mar-2013 | 3.200000 | 1.300000 | 1.500000 |
| Apr-2013 | 3.300000 | 1.300000 | 1.700000 |
| May-2013 | 3.300000 | 1.300000 | 1.600000 |
| Jun-2013 | 3.200000 | 1.200000 | 1.600000 |
| Jul-2013 | 3.300000 | 1.200000 | 1.700000 |
| Aug-2013 | 3.400000 | 1.200000 | 1.700000 |
| Sep-2013 | 3.400000 | 1.300000 | 1.700000 |
| Oct-2013 | 3.300000 | 1.100000 | 1.800000 |
| Nov-2013 | 3.400000 | 1.100000 | 1.800000 |
| Dec-2013 | 3.300000 | 1.200000 | 1.700000 |
| Jan-2014 | 3.300000 | 1.300000 | 1.700000 |
| Feb-2014 | 3.400000 | 1.200000 | 1.800000 |
| Mar-2014 | 3.400000 | 1.200000 | 1.800000 |
| Apr-2014 | 3.500000 | 1.200000 | 1.700000 |
| May-2014 | 3.500000 | 1.200000 | 1.800000 |
| Jun-2014 | 3.500000 | 1.200000 | 1.800000 |
| Jul-2014 | 3.600000 | 1.300000 | 1.800000 |
| Aug-2014 | 3.400000 | 1.200000 | 1.800000 |
| Sep-2014 | 3.600000 | 1.200000 | 2.000000 |
| Oct-2014 | 3.700000 | 1.200000 | 2.000000 |
| Nov-2014 | 3.600000 | 1.100000 | 1.900000 |
| Dec-2014 | 3.700000 | 1.200000 | 1.900000 |
| Jan-2015 | 3.500000 | 1.200000 | 2.000000 |
| Feb-2015 | 3.600000 | 1.200000 | 1.900000 |
| Mar-2015 | 3.600000 | 1.300000 | 2.000000 |
| Apr-2015 | 3.600000 | 1.300000 | 1.900000 |
| May-2015 | 3.600000 | 1.200000 | 1.900000 |
| Jun-2015 | 3.700000 | 1.300000 | 1.900000 |
| Jul-2015 | 3.600000 | 1.200000 | 1.900000 |
| Aug-2015 | 3.600000 | 1.200000 | 1.900000 |
| Sep-2015 | 3.600000 | 1.300000 | 1.900000 |
| Oct-2015 | 3.600000 | 1.200000 | 1.900000 |
Note: Shaded areas denote recessions. The hires rate is the number of hires during the entire month as a percent of total employment. The layoff rate is the number of layoffs and discharges during the entire month as a percent of total employment. The quits rate is the number of quits during the entire month as a percent of total employment.
Source: EPI analysis of Bureau of Labor Statistics Job Openings and Labor Turnover Survey
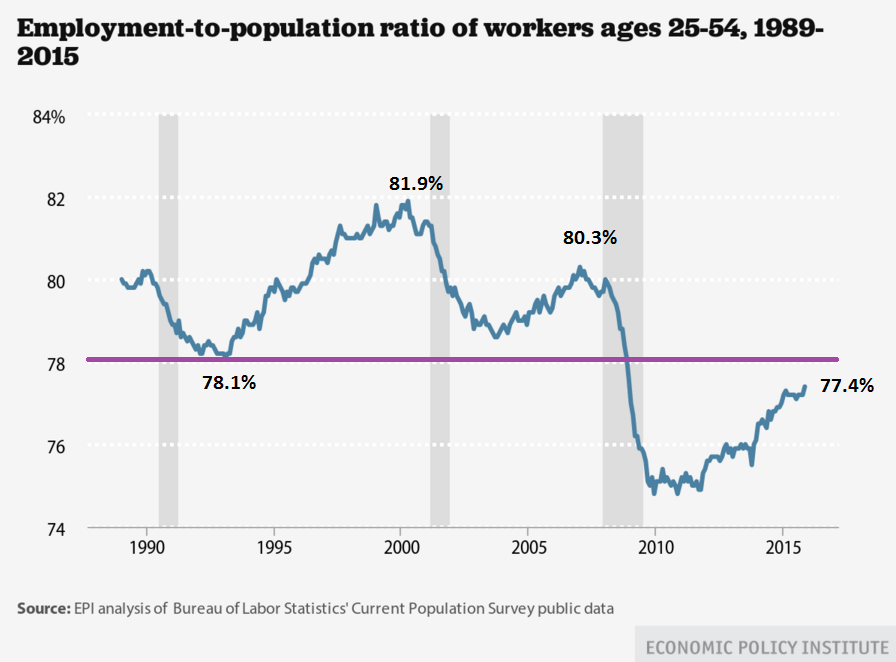
Other signs of continued slack were found in the employment report last Friday. The prime-age employment to population ratio ticked up slightly in November after holding steady for most of the year. It now sits at 77.4 percent, 2.9 percentage points before its peak in January 2007 of 80.3 percent.
At its current rate of 77.4 percent, the prime-age EPOP is still below the lowest level of the last two full business cycles. And, it’s even further below its peak (81.9 percent) in the full employment economy of the late 1990s and 2000.
And the final, but arguably most important, indicator of labor market slack (particularly for the Federal Reserve’s upcoming meeting), is wage growth. Year over year nominal hourly wage growth is 2.3 percent, stubbornly weak and significantly below target levels. While it is likely that the Fed will raise rates next week, the evidence continues to suggest that waiting until the labor market tightens further would be a better course of action.
Enjoyed this post?
Sign up for EPI's newsletter so you never miss our research and insights on ways to make the economy work better for everyone.