Job openings still near historic high in May while hires and separations were little changed
Below, EPI senior economist Elise Gould offers her initial insights on today’s release of the Job Openings and Labor Turnover Survey (JOLTS) for May. Read the full Twitter thread here.
The hires and layoffs rates held steady in May as the quits rate ticked down slightly. Hires remain elevated by historical standards as workers get (re)absorbed into the labor market. High quits signals a stronger labor market where workers can quit, search, and obtain new jobs. pic.twitter.com/0MYPh51VD6
— Elise Gould (@eliselgould) July 6, 2022
Against panic: The Fed should not be given permission to cause a recession in the name of inflation control
The disappointing May data on consumer prices—showing continued strong growth of overall inflation and no real reduction of core inflation—seem to have been a turning point in how many influential policymakers and analysts view the U.S. inflation problem. In particular, it has inspired near-panic and damaging exhortations that the Federal Reserve should push the economy to the brink of recession in the name of fighting inflation. It has also led to preemptive absolutions of the Fed of any criticism that might come their way if a recession does result from steep interest rate increases.
This panic is unwarranted, and the Federal Reserve should not feel free to ratchet up interest rates without regard to the risk of recession. Years from now, a recession induced by the Fed raising rates too quickly will be seen clearly as a policy mistake that could have been avoided. This conclusion stems from several simple facts:
- Both real output and the economy’s underlying productive capacity (potential output) are essentially in line with what pre-pandemic forecasts projected by mid-2022. None of these pre-pandemic forecasts indicated this would imply economic overheating by now. Given this, the macroeconomic balance between demand and supply cannot be so out of alignment that it explains a large share of the acceleration of inflation in the past 15 months.
- Crucially, potential gross domestic product (GDP) was clearly above actual GDP for most of 2021 when inflation started. This is very hard to square with macroeconomic imbalances driving the rise of inflation.
- Finally, there is rich, existing literature on the degree of inflation to expect given an overshoot of aggregate demand over potential supply. These estimates imply substantially less inflation than we’ve seen to date, meaning that factors besides simple macroeconomic imbalances are likely at play.
- While the May price data were discouraging, there is reason to think that some of the drivers of inflation in recent months may be losing steam.
- Profit margins are still at historically high levels but have come down significantly in 2022.
- Wage growth has lagged inflation over the entire episode and has even decelerated in recent periods. This means that wages’ role as a dampener of inflation looks set to continue (and maybe even strengthen) in coming months.
- The main channel through which higher interest rates will put downward pressure on prices runs through a softer labor market (higher unemployment) reducing growth in labor incomes, which reduces demand and reduces pressure on prices from the cost side as well. But, labor income growth has not been a key driver of inflation so far; in fact, wage growth has significantly dampened the growth of inflation over the past 15 months. In the past six months, hourly wage growth is actually running at a pace entirely consistent with the Federal Reserve’s 2% long-run inflation target.
Revoking tariffs would not tame inflation: But it would leave our supply chains even more vulnerable to disruption
Key takeaways:
- Section 232 and 301 tariffs have nothing to do with the current inflationary spike. The tariffs—implemented in 2018—had little effect on U.S. prices, and inflation only spiked after the pandemic recession began in February 2020.
- Eliminating tariffs would not significantly reduce inflation. At best, removing these tariffs would result in a one-time price decrease of 0.2%—a drop in the bucket when consumer prices have risen by more than three times as much, on average, every month since January 2021, driven largely by pandemic-related global supply chain disruptions and the war in Ukraine.
- Removing these tariffs would undermine U.S. steel and aluminum industries and increase domestic dependence on unstable supply chains. Tariff removal would result in job losses, plant closures, cancellations of planned investments, and further destabilize the U.S. manufacturing base at a time of intensifying strategic importance for good jobs, national security, and the race to green industry.
With dwindling options on inflation and a mounting chorus of special interest business lobbies, the Biden-Harris administration is reportedly considering removing some Trump-era tariffs in an effort to moderate rising prices in the U.S. economy.
Tempting as such an action may seem, it is certain to have unnoticeable effects on overall prices—at best. And the action will ensure, moving forward, that our supply chains will be even more vulnerable to the kinds of disruption risks we are seeing play out right now. These tariffs offer a tangible policy response to a real-world economy rife with market failures that invalidate the predictions of canonical economic trade models used to argue against keeping the tariffs.
In the absence of a more comprehensive approach to U.S. industrial strategy, the tariffs are working to resuscitate America’s industrial base and have done so with no meaningful adverse impacts on prices. Pulling the rug from under this rebuild now, without first putting in place other policy solutions to address costly market failures, risks undoing this progress and jeopardizing the financial conditions in industries that are critical to building the infrastructure and renewable energy investments needed to power future economic growth.
Local governments stepping in to bolster workers’ rights
There has been a surge of action in cities and other localities across the country to advance workers’ rights.
A just released report, issued by EPI, the Harvard Labor and Worklife Program, and Local Progress, provides a comprehensive overview of this local government labor activity, highlighting what cities and other localities have been doing and offering a blueprint of what they can do.
Some examples:
- 52 localities have enacted their own higher local minimum wages, and 19 have passed paid sick leave laws. Some cities have passed cutting-edge laws requiring predictable scheduling, outlawing arbitrary firings in certain industries, securing pay for independent freelance workers, and protecting workers during the COVID-19 pandemic.
- At least 20 localities have created or are creating dedicated local labor agencies, including large coastal cities like New York, San Francisco, and Seattle, as well as cities like Chicago, Denver, Minneapolis, Saint Paul, and soon Tucson.
- Some cities are requiring high-road or at least legally compliant practices among their contractors by setting prevailing or living wages, or passing responsible bidder ordinances. Others have set up systems under which permits or licenses can be revoked for labor violations.
- Although some cities are preempted by state law from passing laws, there’s still a lot they can do: educating workers about their rights, providing good jobs to their own municipal employees, setting high standards for contractors and vendors, reporting on local conditions, and showing public support to workers standing up for their labor rights.
Although many local governments have embraced this new role of looking out for workers, there’s still tremendous untapped potential for more action.
Young adults are graduating into a more promising labor market
As young adults across the country graduate from high school and college, it’s an appropriate time to reexamine how the labor market is performing for young workers. Young workers, 16–24 years old, were among the hardest hit in the pandemic recession, given their vulnerability to labor market downturns in general and their specific exposure to economic weakness in the pandemic. For instance, a quarter of young workers had leisure and hospitality jobs, where employment declined 41% in the spring of 2020.
Fortunately, unlike the protracted recovery from the Great Recession, policymakers responded to the pandemic recession by enacting policies at the scale of the problem. As a result, the economy bounced back quickly, and employment is now within 1% of pre-recession levels. Mirroring the overall labor market recovery, young workers have also experienced a tremendous recovery from the depths of the pandemic recession.
In April 2020, the overall unemployment rate spiked to 14.7%. Over the last three months, the unemployment rate has leveled out at 3.6%—basically at pre-pandemic levels—while labor force participation continues to recover steadily. Figure A compares the unemployment rate of young adults, ages 16–24, with workers ages 25 and up through the last two recessions. There are two key factors to note from the figure. First, young workers tend to have much higher unemployment rates than older workers, on average about two and a half times higher. Second, both groups of workers saw a huge increase in unemployment in the spring of 2020 and both groups have experienced a tremendous bounce back, far faster than the recovery from the Great Recession.
Proposed New York state minimum wage increases would lift wages for more than 2 million workers through 2026: Minimum wages would range by region from $16.35 to $21.25 per hour by 2026
Proposed legislation in the New York state legislature would ensure that low-wage workers in New York are protected from rising prices and benefit from improvements in the broader economy. Senate bill S3062C and assembly bill A7503B would schedule annual increases to the minimum wage that would be linked (or “indexed”) to the combination of the consumer price index (CPI) and a measure of labor productivity. We estimate that the resulting increases in the state minimum wage would lift wages for more than 2 million New Yorkers through 2026.
New York’s minimum wage law sets separate minimum wages for three different regions of the state: New York City, the suburban counties of Nassau, Suffolk, and Westchester, and the remainder of upstate New York. Under current projections1 for inflation and labor productivity, as shown in Table 1, indexing the minimum wage to changes in prices and productivity would increase New York City’s minimum wage from $15.00 where it is now to $21.25 by 2026. Nassau, Suffolk, and Westchester counties’ minimum wage would rise from $15.00 to $18.65 by 2026, and the rest of the state would increase from $13.20 to $16.35.
Since New York state law sets the minimum wage for tipped workers (also known as the “tipped minimum wage”) at two-thirds of the regular minimum wage, these changes would also lead to a rising tipped minimum wage and pay increases for the state’s tipped workers. As discussed more below, indexing the minimum wage in this way would protect the buying power of millions of low-wage workers’ paychecks and, in particular, improve the economic security of predominantly women, Black, and Latinx workers.
Understanding economic disparities within the AAPI community
Key takeaways:
- More than 26 different nations are represented in the AAPI community in the U.S. The broad generalization inherent in the AAPI categorization can obscure the economic reality for many groups within the AAPI community.
- Disaggregated hourly wage data show that groups within the AAPI community face economic disparities. While AAPI average wages are close to the national average, many groups within the AAPI community lag behind.
- Differing immigration paths and histories within the AAPI community influence which groups might be doing better economically in the United States today.
The U.S. Asian American and Pacific Islander (AAPI) community encompasses over 24 million people, with origins spanning countries in Central, East, and Southeast Asia, the Indian subcontinent, and the island nations in the Pacific.1 This diverse population has been growing rapidly in the United States: Between 2010 and 2020, there was a nearly 40% increase in the number of people who identified as Asian alone or in combination, and a 30% increase for Native Hawaiians and other Pacific Islanders.
Whether they have immigrated recently or lived in the United States for centuries, the AAPI community is a vital piece of American society and the workforce. It is important to note, however, that this group is not a monolith, and examining AAPIs as an aggregate can obscure the economic reality for many groups within the AAPI community. In this post, we examine this varied group in more detail and calculate their hourly wages at a disaggregated level to shed greater light on the actual economic circumstances of Asian Americans and Pacific Islanders, and the economic disparities they may face.
Debunking 5 top inflation myths
The labor market is largely strong right now, but inflation continues to be a pressing economic concern.
The reasons for escalating inflation are hotly debated, but some theories gaining traction have not been grounded in the data. EPI research sets the record straight on the causes of inflation—and how policymakers can best restrain it. Below, we debunk 5 top inflation myths.
- Myth #1: Workers’ wage growth is driving inflation. Nominal wage growth—while faster relative to the recent past—has lagged far behind inflation, meaning that labor costs have been dampening, not amplifying, inflationary pressures all along.
- Myth #2: Corporate profits are not contributing to inflation. In fact, fatter corporate profit margins have driven over half of the increase in prices in the nonfinancial corporate sector between the second quarter of 2020 and the end of 2021. This is not normal. From 1979 to 2019, profits only contributed about 11% to price growth. Ignoring the role of profits makes inflation analyses a lot weaker.
- Myth #3: Federal relief and recovery measures overheated the economy and fed inflation. Evidence from the past 40 years suggests strongly that profit margins should shrink and the share of corporate income going to labor compensation should rise as unemployment falls and the economy heats up. But the exact opposite pattern has happened so far in the recovery—casting much doubt on inflation expectations rooted simply in claims of macroeconomic overheating. In short, the labor market is strong, but it’s not overheating.
- Myth #4: Removing import tariffs would be a major tool to fight inflation. Tariffs were put in place far before early 2021 when inflation began rising, and eliminating tariffs could not significantly restrain it. Further, removing tariffs would not be costless. Tariff removal could result in job losses, plant closures, cancellations of planned investments, and further destabilization of the domestic manufacturing base, which would increase domestic dependence on unstable import supply chains.
- Myth #5: Investments in child and elder care would accelerate inflation. In fact, investments in child and elder care could help restrain inflationary pressures. By subsidizing families’ use of child and elder care and providing direct investments to providers, such investments could boost future labor supply by allowing working-age parents or children who want to look for paid employment to do so while remaining confident their family members are receiving care.
Job and wage growth moderate in May: The labor market is not overheating
Below, EPI economists offer their initial insights on the jobs report released this morning, which showed 390,000 jobs added in May and wage growth moderating.
What to watch on jobs day: The labor market is strong, not overheating
On Friday, the Bureau of Labor Statistics (BLS) will release the latest numbers on the state of the labor market. Along with rising payroll employment and increases in labor force participation as workers enter or return to the labor market, I will continue to watch nominal wage growth. While some have pointed to fast nominal wage growth as a source of concern in the U.S. economy, this is largely misplaced. Instead, nominal wage growth continues to dampen, not amplify, inflationary pressures, and it has actually decelerated in recent months. And, nominal wage growth running faster than pre-pandemic rates has managed to provide a useful spur to hiring in sectors that were most damaged by the pandemic shock.
Over the last year, in a welcome change, wage growth has been faster at the lower end of the wage distribution, as the labor market has improved and employers try to attract and retain the workers they want. At the same time, employment has grown dramatically because Congress made fiscal investments at the scale of the problem, and employment in the private sector is now within 1% of pre-pandemic levels. While some complain that any wage growth faster than pre-pandemic rates is a sign of damaging labor shortages that are constraining growth, this doesn’t fit the facts. At a macroeconomic level, the economy continues to absorb new workers at historically high rates. And across industries, there is no evidence that fast wage growth is constraining job growth.
Job openings declined in April while layoffs hit a series low
Below, EPI senior economist Elise Gould offers her initial insights on today’s release of the Job Openings and Labor Turnover Survey (JOLTS) for April. Read the full Twitter thread here.
Hires and quits rates both held steady in April as layoffs edged down. Hires remain elevated by historical standards as workers get (re)absorbed into the labor market. High quits is a sign of a strengthening labor market where workers can quit, search, and obtain new jobs. pic.twitter.com/gjrHN2sPPQ
— Elise Gould (@eliselgould) June 1, 2022
The future of work depends on stopping Amazon’s union busting: Shareholders and policymakers must all play a role in protecting Amazon workers’ rights
This week’s Amazon shareholder meeting provides an important opportunity to consider urgent steps shareholders and policymakers can take to protect the threatened rights of unionizing Amazon workers and counter the company’s growing impact on income inequality, racial and gender disparities, and the degradation of work across the labor market.
The agenda for the May 25th annual meeting includes the election of company directors, approval of executive compensation, and several shareholder resolutions concerning Amazon’s employment practices and labor law violations. While Amazon opposes all these resolutions, shareholders should take the opportunity to reject excessive pay for Amazon’s CEO and support resolutions calling for audits of worker health and safety, racial equity and racial and gender pay gaps, employee turnover, and Amazon policies and practices affecting workers’ rights to freedom of association and collective bargaining. Meanwhile, state and federal policymakers should take note of the policy priorities the resolutions suggest for ensuring that Amazon’s anti-union, high-risk, high-turnover business model isn’t allowed to dictate the future of work in the United States and across the globe.
Amazon’s use of a wide range of legal and illegal tactics to prevent workers from unionizing has been well documented. Amazon engaged in months of coercion, intimidation, vote gerrymandering, and retaliation against Bessemer, Alabama, warehouse workers in the lead-up to their 2021 union election. Aggressive company surveillance led many workers to believe the company was monitoring their secret ballot votes—an offense so egregious it led the National Labor Relations Board (NLRB) to order a brand-new election (the 2022 outcome of which remains too close to call).
In April, Amazon workers at the JFK8 warehouse in Staten Island overcame similar obstacles, including numerous Amazon labor law violations, to win a decisive union election victory. In response, Amazon has refused to recognize the new Amazon Labor Union, instead dragging out legal challenges and refusing to meet with workers to start bargaining a contract. A new report published last week further documents the failure of Amazon’s corporate policies and practices to meet international human rights standards for respecting workers’ rights to freedom of association and collective bargaining.
Guest post: Food insufficiency in families with children increased after expiration of Child Tax Credit monthly payments
Amidst the continuing COVID-19 pandemic and increased inflation, 15% of households with children reported food insufficiency in March–April 2022. The reports of food insufficiency—sometimes or often not having enough food to eat in the past week—are from the nationally representative Household Pulse Survey (HPS), an internet survey conducted by the U.S. Census Bureau.
Food insufficiency among families with children poses a short- and long-term moral and economic threat to the United States. Even brief disruptions in access to food can have lasting consequences. Not having enough to eat often disrupts children’s cognitive and emotional development and education. This was the case for a child who disclosed that the reason she was fidgeting and not paying attention in class was that she did not have enough food to eat. There may be lifelong ramifications of not having enough to eat in childhood, including increased likelihood of poor health outcomes and avoidable medical expenditures across the lifespan.
Fortunately, Congress can help. Several studies indicate that advance Child Tax Credit (CTC) payments, expanded under the American Rescue Plan Act, were associated with reduced poverty and food insufficiency in households with children.
Following Dr. Lisa Cook’s historic confirmation to the Federal Reserve Board, we must acknowledge the importance of Black economists for public policy and the economy
Earlier this year, President Biden nominated two Black economists, Dr. Lisa Cook and Dr. Philip Jefferson, to serve as members of the Federal Reserve Board of Governors. On May 10, 2022, Dr. Cook was confirmed in a 51–50 party-line vote, which made her the first Black woman to sit on the Board in its 108-year history. The following day, Dr. Jefferson was confirmed on a 91–7 bipartisan vote, making him the fourth Black man to sit on the Board, but marking the first time two Black governors will serve simultaneously.
Despite this tremendous accomplishment, the nomination of Dr. Cook faced great scrutiny and criticism, with several Senate members questioning her qualifications and expertise despite her years of professional and academic experience in economic development, financial institutions and markets, economic history, and international relations. Sadly, this isn’t new for Black professionals, and specifically not for Black women.
Within the workplace and historically, Black women’s skills and contributions are often undermined, underappreciated, and devalued. These discriminatory roots have led to intersectional gender and racial inequities in the kinds of jobs Black women are hired for as well as the wages and benefits they receive. However, another glaring detail we can glean from the captious confirmation process of Dr. Cook—and the exclusion of Black women from the Federal Reserve Board’s panel for over a century—is how Black economists are broadly underrepresented and their essential view on racial economic inequality is often discounted.
The underrepresentation of Black scholars in the field of economics can be traced to the low numbers of Black students pursuing degrees in economics. In the academic year 2019–2020, there were more than 1,200 doctoral degrees awarded to students in economics. However, less than 2% of doctoral degrees were awarded to Black economics students overall and less than 1% were awarded to Black women. For undergraduate students, Black students overall accounted for 4.1% of bachelor’s degrees awarded in economics and Black women accounted for only 1.5%.
Abortion rights are economic rights: Overturning Roe v. Wade would be an economic catastrophe for millions of women
A leaked draft of a majority opinion authored by Supreme Court justice Samuel Alito strongly suggests that the court will rule to overturn Roe v. Wade and Planned Parenthood v. Casey, the two landmark cases that have upheld the right to an abortion nationwide for the last half century. If the final ruling largely follows what is sketched out in the leaked draft, abortion services will be drastically curtailed, if not outright banned, in over half the country.
Abortion is often framed as a “culture-war” issue, distinct from material “bread and butter” economic issues. In reality, abortion rights and economic progress are deeply interconnected, and the imminent loss of abortion rights means the loss of economic security, independence, and mobility for millions of women. The fall of Roe will be an additional economic blow, as women in the 26 states likely to ban abortion already face an economic landscape of lower wages, worker power, and access to health care.
Women’s economic lives, livelihoods, and mobility are at the heart of the reasoning to overrule Roe.
In the draft majority opinion, Justice Alito dismissed the argument in Casey that women had organized their lives, relationships, and careers with the availability of abortions services, writing “that form of reliance depends on an empirical question that is hard for anyone—and in particular, for a court—to assess, namely the effect of the abortion right on society and in particular on the lives of women.” In fact, this empirical question has been definitively assessed and answered. A rich and rigorous social science literature has examined both the detrimental effect of a denied abortion on women’s lives, as well as the individual and societal economic benefits of abortion legalization, as detailed in the thorough amicus brief filed in Dobbs on behalf of over 100 economists.
Some of the economic consequences of being denied an abortion include a higher chance of being in poverty even four years after; a lower likelihood of being employed full time; and an increase in unpaid debts and financial distress lasting years. Laws that restrict abortion providers, so-called “TRAP” laws (targeted regulation of abortion providers), have led to women in those states being less likely to move into higher-paying occupations.
On the flip side, environments in which abortion is legal and accessible have lower rates of teen first births and marriages. Abortion legalization has also been associated with reduced maternal mortality for Black women. The ability to delay having a child has been found to translate to significantly increased wages and labor earnings, especially among Black women, as well as increased likelihood of educational attainment. Treasury Secretary Janet Yellen concluded that “eliminating the rights of women to make decisions about when and whether to have children would have very damaging effects on the economy and would set women back decades.”
The draft opinion of this overtly partisan Supreme Court ignores the rigorous data and empirical studies demonstrating the significant economic consequences of this decision. In doing so, it lays bare the cruel and misogynistic politics that motivate it. Justice Alito’s dismissal of claims that forcing women to bear an unwanted pregnancy imposes a heavy burden is shockingly glib, as he simply asserts “that federal and state laws ban discrimination on the basis of pregnancy, that leave for pregnancy and childbirth are now guaranteed by law in many cases, that the costs of medical care associated with pregnancy are covered by insurance or government assistance….”
Every statement in this casual litany is wildly misleading. Women are still routinely fired for being pregnant, close to 9 in 10 workers lacked paid leave in 2020, the costs of maternity care with insurance have risen sharply and constitute a serious economic burden for even middle-income families. And many of the states certain or likely to ban abortion after the fall of Roe have not expanded Medicaid, leaving women without insurance facing much steeper costs—particularly in the immediate post-partum period. And, of course, our failed health care system often imposes the ultimate cost of all on pregnant women: The U.S. rate of maternal mortality, especially for Black women, ranks last among similarly wealthy countries. In short, the potential costs of bearing a child are high indeed, and it is women who should decide if and when they wish to shoulder them.
States likely to ban abortion are more likely to have higher incarceration rates and lag in wages, worker rights, and access to health care
| State | Minimum wage | Incarceration rate (per 100k) | Abortion status | Right to Work key | Medicaid Expansion | Right to Work | Medicaid Expansion key | Abortion status key |
|---|---|---|---|---|---|---|---|---|
| Alabama | $7.25 | 419 | Pre-Roe ban or bans/extreme limits | RTW | No Expansion | 1 | 1 | 2 |
| Alaska | $10.34 | 243 | No change | Not RTW | Adopted Expansion | 0 | 0 | 0 |
| Arizona | $12.80 | 556 | Pre-Roe ban or bans/extreme limits | RTW | Adopted Expansion | 1 | 0 | 2 |
| Arkansas | $11.00 | 585 | Trigger ban | RTW | Adopted Expansion | 1 | 0 | 1 |
| California | $14.00 | 310 | No change | Not RTW | Adopted Expansion | 0 | 0 | 0 |
| Colorado | $12.56 | 342 | No change | Not RTW | Adopted Expansion | 0 | 0 | 0 |
| Connecticut | $13.00 | 246 | No change | Not RTW | Adopted Expansion | 0 | 0 | 0 |
| Delaware | $10.50 | 380 | No change | Not RTW | Adopted Expansion | 0 | 0 | 0 |
| Washington D.C. | $15.20 | N/A | No change | Not RTW | Adopted Expansion | 0 | 0 | 0 |
| Florida | $10.00 | 444 | Likely to ban | RTW | No Expansion | 1 | 1 | 3 |
| Georgia | $7.25 | 507 | Pre-Roe ban or bans/extreme limits | RTW | No Expansion | 1 | 1 | 2 |
| Hawaii | $10.10 | 215 | No change | Not RTW | Adopted Expansion | 0 | 0 | 0 |
| Idaho | $7.25 | 474 | Trigger ban | RTW | Adopted Expansion | 1 | 0 | 1 |
| Illinois | $12.00 | 303 | No change | Not RTW | Adopted Expansion | 0 | 0 | 0 |
| Indiana | $7.25 | 400 | Likely to ban | RTW | Adopted Expansion | 1 | 0 | 3 |
| Iowa | $7.25 | 293 | Pre-Roe ban or bans/extreme limits | RTW | Adopted Expansion | 1 | 0 | 2 |
| Kansas | $7.25 | 342 | No change | RTW | No Expansion | 1 | 1 | 0 |
| Kentucky | $7.25 | 515 | Trigger ban | RTW | Adopted Expansion | 1 | 0 | 1 |
| Louisiana | $7.25 | 678 | Trigger ban | RTW | Adopted Expansion | 1 | 0 | 1 |
| Maine | $12.75 | 146 | No change | Not RTW | Adopted Expansion | 0 | 0 | 0 |
| Maryland | $12.50 | 305 | No change | Not RTW | Adopted Expansion | 0 | 0 | 0 |
| Massachusetts | $14.25 | 133 | No change | Not RTW | Adopted Expansion | 0 | 0 | 0 |
| Michigan | $9.87 | 381 | Pre-Roe ban or bans/extreme limits | RTW | Adopted Expansion | 1 | 0 | 2 |
| Minnesota | $10.33 | 177 | No change | Not RTW | Adopted Expansion | 0 | 0 | 0 |
| Mississippi | $7.25 | 636 | Trigger ban | RTW | No Expansion | 1 | 1 | 1 |
| Missouri | $11.15 | 423 | Trigger ban | Not RTW | Adopted Expansion | 0 | 0 | 1 |
| Montana | $9.20 | 439 | Likely to ban | Not RTW | Adopted Expansion | 0 | 0 | 3 |
| Nebraska | $9.00 | 289 | Likely to ban | RTW | Adopted Expansion | 1 | 0 | 3 |
| Nevada | $9.75 | 412 | No change | RTW | Adopted Expansion | 1 | 0 | 0 |
| New Hampshire | $7.25 | 197 | No change | Not RTW | Adopted Expansion | 0 | 0 | 0 |
| New Jersey | $13.00 | 209 | No change | Not RTW | Adopted Expansion | 0 | 0 | 0 |
| New Mexico | $11.50 | 315 | No change | Not RTW | Adopted Expansion | 0 | 0 | 0 |
| New York | $13.20 | 224 | No change | Not RTW | Adopted Expansion | 0 | 0 | 0 |
| North Carolina | $7.25 | 313 | No change | RTW | No Expansion | 1 | 1 | 0 |
| North Dakota | $7.25 | 231 | Trigger ban | RTW | Adopted Expansion | 1 | 0 | 1 |
| Ohio | $9.30 | 430 | Pre-Roe ban or bans/extreme limits | Not RTW | Adopted Expansion | 0 | 0 | 2 |
| Oklahoma | $7.25 | 621 | Trigger ban | RTW | Adopted Expansion | 1 | 0 | 1 |
| Oregon | $12.75 | 353 | No change | Not RTW | Adopted Expansion | 0 | 0 | 0 |
| Pennsylvania | $7.25 | 355 | No change | Not RTW | Adopted Expansion | 0 | 0 | 0 |
| Rhode Island | $12.25 | 156 | No change | Not RTW | Adopted Expansion | 0 | 0 | 0 |
| South Carolina | $7.25 | 352 | Pre-Roe ban or bans/extreme limits | RTW | No Expansion | 1 | 1 | 2 |
| South Dakota | $9.95 | 426 | Trigger ban | RTW | No Expansion | 1 | 1 | 1 |
| Tennessee | $7.25 | 384 | Trigger ban | RTW | No Expansion | 1 | 1 | 1 |
| Texas | $7.25 | 529 | Trigger ban | RTW | No Expansion | 1 | 1 | 1 |
| Utah | $7.25 | 207 | Trigger ban | RTW | Adopted Expansion | 1 | 0 | 1 |
| Vermont | $12.55 | 182 | No change | Not RTW | Adopted Expansion | 0 | 0 | 0 |
| Virginia | $11.00 | 421 | No change | RTW | Adopted Expansion | 1 | 0 | 0 |
| Washington | $14.49 | 250 | No change | Not RTW | Adopted Expansion | 0 | 0 | 0 |
| West Virginia | $8.75 | 380 | Pre-Roe ban or bans/extreme limits | RTW | Adopted Expansion | 1 | 0 | 2 |
| Wisconsin | $7.25 | 378 | Pre-Roe ban or bans/extreme limits | RTW | No Expansion | 1 | 1 | 2 |
| Wyoming | $7.25 | 426 | Trigger ban | RTW | No Expansion | 1 | 1 | 1 |
Source: Elizabeth Nash and Lauren Cross, “26 States Are Certain or Likely to Ban Abortion without Roe: Here’s Which Ones and Why,” The Guttmacher Institute, October 2021; “State Minimum Wage Laws, Department of Labor, Updated January 2022; Kaiser Family Fund, “Status of State Medicaid Expansion Decisions,” April 26, 2022; E. Ann Carson, "Prisoners in 2020 -- Statistical Tables," U.S. Department of Justice Bureau of Justice Statistics, December 2020; "Right-to-Work States," National Conference of State Legislatures, Updated 2017.
Recognizing that abortion is an economic issue is an important step in building support for protecting women’s right of access. But this recognition also allows us to see the potential fall of Roe v. Wade as a key piece in a broader politics and economics of control. Twenty-six states currently have laws or constitutional amendments on their books that ban abortion. If Roe is declared overruled, these bans will go into effect. Low- and middle-income women, especially Black and Brown women, will bear the brunt of the impact. Many of the states with preexisting abortion bans held at bay by Roe are also states that have created an economic policy architecture of low wages, barely functional or funded public services, at-will employment, and no paid leave or parental support. In these states, the denial of abortion services is one more piece in a sustained project of economic subjugation and disempowerment.
Figure A shows the 26 states that have “trigger bans” that will set in immediately after the SCOTUS decision, pre-Roe bans or extreme limits, and likely bans. Figure A also shows the minimum wage in that state, whether that state is a so-called “right-to-work” state that makes it harder for workers to collectively bargain and unionize, whether the state has expanded Medicaid, and the rate of incarceration per 100,000 people in that state. While wages and access to health care (through Medicaid) are relatively obvious measures of well-being, so-called “right-to-work” laws are also useful to look at as worker power and unionization also have strong connections to economic, social, and physical health. Mass incarceration and the criminal justice system are also deeply intertwined with racial and economic inequality, from the impact of a criminal record on employment and earnings, to the intergenerational effects on families and communities.
It is no coincidence that the states that will ban abortion first are also largely the states with the lowest minimum wages, states less likely to have expanded Medicaid, states more likely to be anti-union “Right-to-Work” states, and states with higher-than-average incarceration rates. For example, among the states which will ban abortion, the average minimum wage is $8.39, compared with $11.48 in the states that have abortion access. Similarly, 10 of the 26 anti-abortion states have not expanded Medicaid, and all but two of the states are anti-union “right-to-work” states. While the nationwide rate of incarceration is 419 per 100,000 people, in the 26 anti-abortion states the average incarceration rate is 439 per 100,000 people, compared with 272 for the states without abortion restrictions. The consequences of low wages and lack of access to health care, including abortion services, falls especially hard on Black women in many of these states. There is a long history of racism motivating political organization, like the rise of “right-to-work” legislation in the Jim Crow south, or the complicated combination of anti-abortion politics and backlash against desegregation efforts during the political realignment of the 1970s.
Policymakers and advocates must recognize that the fall of Roe is an economic issue and would be one more victory for the economics of control and disempowerment—low wages, little worker power, and rising disinvestment. Reproductive justice is key to economic justice and protects women’s humanity, dignity, and the right to exert freedom over their own choices in the economy.
Ignoring the role of profits makes inflation analyses a lot weaker
Washington Post columnist Catherine Rampell wrote last week that those pointing to the role of fatter profit margins in driving price inflation are engaged in “conspiracy theories,” and argued that the conspiracy theorists are distracting attention from things that could really lead to lower inflation: faster immigration and removing import tariffs. It’s a pretty unconvincing column all around.
First, the alleged inflation cures that attention is being pulled away from are really weak tea. The case for faster immigration helping to quell inflation runs through its effect on labor markets. If faster immigration increases labor supply this could in theory dampen wage growth. But wage growth has not been the source of the current inflation. And recent readings on wage growth have it roughly consistent with relatively normal rates of inflation. Putting further downward pressure on wage growth that is already lagging far behind inflation would just increase the burden of adjustment to more normal inflation that will be borne by workers.
No more union-busting. It’s time for companies to give their workers what they deserve
This is an excerpt from an op-ed in CNN Business. Read the full op-ed here.
This year, workers at Amazon, Starbucks and other major corporations are winning a wave of union elections, often in the face of long odds and employer resistance. These wins are showing it’s possible for determined groups of workers to break through powerful employers’ use of union-busting tactics, ranging from alleged retaliatory firings to alleged surveillance and forced attendance at anti-union “captive audience meetings.” But workers should not have to confront so many obstacles to exercising a guaranteed legal right to unionize and bargain for improvements in their work lives and livelihoods.
There are good reasons to believe workers’ organizing momentum will continue (union election filings are already up 57% during the first six months of this fiscal year). Frontline workers are asserting their worth after more than two years of risking their health during an ongoing pandemic while watching corporate profits and CEO pay continue to soar.
The U.S. tax code functionally rewards corporations who use anti-union consultants: Congress must take action
The U.S. tax system is deeply flawed. While millions of working-class Americans pay their fair share, corporations are dodging more and more of their tax responsibilities. Despite record profits, corporate taxes are way down, as corporations exploit loopholes that allow for offshore profit-shifting and various tax breaks and deductions. Specifically, the 2017 Tax Cuts and Jobs Act (TCJA) decreased the statutory corporate income tax rate from 35% to 21% and simultaneously introduced new tax loopholes. Consequently, the TCJA has slashed the effective tax rate for corporations almost in half, further damaging the progressivity of the overall federal tax system. In turn, this erosion of corporate liability and the proliferation of tax avoidance have exacerbated inequality, with the working class facing starved social services, reduced household incomes, and lower standards of living.
One proven tool to combat this rise in inequality is unions. By bringing workers’ collective power to the bargaining table, unions are able to win better wages and benefits for working people—reducing income inequality as a result. Yet data show that U.S. employers are willing to use a wide range of legal and illegal tactics to frustrate the rights of workers to form unions and collectively bargain. And much like our overall tax system favors corporations over working people, the tax code functionally rewards corporations for anti-union activities that suppress worker power.
Wage growth has been dampening inflation all along—and has slowed even more recently
Yesterday’s inflation data for April 2022 was a mixed bag but had some encouraging seeds in it. Measured year-over-year, overall and core inflation (inflation minus the influence of volatile food and energy prices) both ticked down slightly. Measured just over the past month, the overall index decelerated significantly, but the core index rose back up to the level it had plateaued at in the five months before March. This post is about why wage trends—both throughout the inflationary burst and in very recent months—should make us even a bit more encouraged that inflation can be brought back under control without the Federal Reserve having to move interest rates to a radically more contractionary stance.
There has been a lot of discussion—and confusion—recently about the role of tight labor markets (“the Great Resignation”) in the rise of inflation we’ve seen since early 2021. In this post, we make the following points about the wage/price relationship:
- To date, the rise of inflation has unambiguously not been driven by tight labor markets pushing up wages.
- Nominal wage growth has been fast over the past year relative to the past few decades, but it has lagged far behind inflation, meaning that labor costs are dampening—not amplifying—price pressures. Last week’s jobs report showed that average hourly earnings growth over the last quarter was 4.4% (at an annualized rate), with wage growth actually slowing in the last three months to under 4%.
- If the only change in the economy over the past year had been the acceleration of nominal wage growth relative to the recent past, then inflation would be roughly 2.5–4.5% today, instead of the 8.6% pace it ran through March. In short, nonwage factors are clearly the main drivers of inflation.
- Claims that the Federal Reserve needs to shift into a much more hawkish mode to keep wages from amplifying inflation and to bring inflation back down to more normal levels are often greatly overstated and understate how much damage this strategy could cause.
- As long as wage growth is dampening inflation (and it is), then the question of how hawkish the Fed must be is not a question of whether inflation will return to more normal levels, but just how quickly we want that happen.
- A much quicker return to more normal inflation would require sacrificing important gains that stem from low unemployment, even though a return to more normal inflation is quite likely to occur on its own. This makes the cost of a more hawkish stance (more joblessness) high and the benefits (a few months of slightly lower inflation as we get back to normal) pretty low.
Strong and equitable unemployment insurance systems require broadening the UI tax base
The COVID-19 pandemic showed how critical unemployment insurance (UI) is for sustaining workers and the economy during times of crisis, while also revealing deep fissures and inequities in UI systems. Federal programs that expanded UI eligibility, benefit levels, and benefit duration kept local economies afloat and became a lifeline for millions during the early stages of the pandemic, but the crush of UI claims at peak levels of unemployment also exposed the poor condition of state UI systems. From backlogs and delays caused by insufficient administrative capacity and outdated technology to inadequate benefit amounts, many state UI systems operate in a chronic state of underfunding that results in inequity and dysfunction.
One of the root causes of these problems is rarely discussed: Lawmakers have structured state UI financing in a way that permanently starves the UI system. UI is currently funded through a combination of federal and state taxes paid by employers, where state UI taxes pay for benefits during normal economic times. However, in most states, the amount of employee wages on which employers pay state UI taxes, i.e., the taxable wage base (TWB), is extremely low. At present, 14 states and Washington, D.C. have taxable wage bases below $10,000 and a remarkable 36 states have their bases set below $25,000. This means that in 71% of states, employers pay UI taxes at most on the first $25,000 of an employee’s annual earnings.
Job growth remains strong in April as wage growth cools
Below, EPI economists offer their initial insights on the jobs report released this morning, which showed 428,000 jobs added in April.
What to watch on jobs day: Wage growth continues to lag inflation
Tomorrow, the Bureau of Labor Statistics (BLS) will release the latest numbers on the state of the labor market. Given fiscal investments at the scale of the problem over the last two years and the resulting trends in payroll employment growth and labor force participation, the labor market is on track for a historically fast and full recovery by the end of 2022.
Even the reported contraction in gross domestic product (GDP) in the first quarter of 2022 won’t push this recovery off track. Most of the slowdown in GDP was due to weak exports (which reflect weakness in trading partner economies, not our own) and to a running down of business inventories, which had been built up at a furious pace in recent quarters. Looking at final sales (so stripping out the inventory effect) to domestic purchasers (so stripping out exports), growth was actually a bit faster in the first quarter of 2022 than it was at the end of 2021.
Moving forward to jobs day, it’s vital to keep tabs on job growth as well as participation to make sure the recovery keeps going strong and reaches all corners of the labor market. It’s also important to track the sectors with particularly large job deficits—like leisure and hospitality—but also state and local jobs, which have had a shallower fall and a slower recovery than the private sector.
Another important metric for a read on the health of the economy and what the Federal Reserve should be doing in the coming year is nominal wage growth. To date, the large increase in inflation since early 2021 has clearly not been driven by labor market trends. In fact, despite being high relative to the recent historical past, nominal wage growth today by every measure is lagging inflation, leading to real wage losses for workers. This is very different than the behavior of wages in previous periods when the unemployment rate was very low and the economy was heating up.
This lagging of nominal wage growth behind price growth has actually dampened inflation so far in this recovery. Tracking this growth going forward is key to deciding whether inflation will stay very high (or even accelerate) or will begin to relent.
Job Openings and Labor Turnover Survey: Job openings and quits edged up to series highs for March
Below, EPI senior economist Elise Gould offers her initial insights on today’s release of the Job Openings and Labor Turnover Survey (JOLTS) for March. Read the full Twitter thread here.
While there was “little changed” overall in the latest #JOLTS data released this morning from the Bureau of Labor Statistics, job openings and quits edged up to series highs for March. Hiring remains strong and hires still significantly outpace quits.https://t.co/djGEusO8gy
— Elise Gould (@eliselgould) May 3, 2022
Much has changed since the first May Day, but building worker power and combating racism and xenophobia remain just as important
May 1 is International Workers’ Day, a day workers around the world mark as Labor Day with marches, demonstrations, and renewed calls for workers’ rights. “May Day” got its start in 1886, when U.S. workers rallied in support of ongoing campaigns for an eight-hour day, setting May 1 as a deadline to begin mass strikes if employers failed to adopt shorter hours.
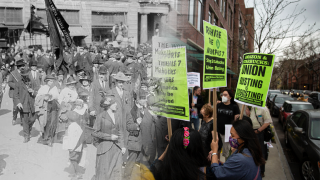
In 1886 Chicago, where tens of thousands joined May Day actions and thousands went on strike, subsequent police shootings of striking workers escalated into the well-known Haymarket Tragedy. Months of state-sanctioned, anti-immigrant repression of labor organizing followed. Police raids of union halls and arrests of organizers culminated in a sham trial, eight guilty verdicts, and public hanging of four prominent immigrant, working-class movement leaders (a fifth died by suicide prior to the execution date). The trial and executions were followed closely by workers across the country and around the world. In memory of the Haymarket Martyrs, labor and socialist organizations declared May Day International Workers’ Day, now an official public holiday in many countries.
Over 100 years later, our May Day 2022 economy has much in common with that of May Day 1886—rising inequality, economic upheavals affecting those with the least financial security, xenophobia, market concentration, and an upsurge in workers taking matters into their own hands while facing intense employer resistance. U.S. factory workers and railroad workers are still campaigning for shorter hours, in some cases striking (or threatening strikes) to challenge inhumane 12-to-14-hour shifts and unpredictable forced overtime. New generations of workers, including many immigrants, are breaking through barriers of employer union-busting to organize unions in warehouses, hospitals, nursing homes, coffee shops, retail stores, media outlets, universities, and beyond.
This Workers Memorial Day, honor lives lost by joining workers’ fight for a future that includes safe work
“Our health is just as essential,” read the homemade sign Chris Smalls carried in front of the Amazon JFK8 Staten Island warehouse on March 30, 2020, a moment when it had become clear that exposure to coronavirus could be deadly. After a week of appealing to management for masks, gloves, and a temporary shutdown to sanitize exposed areas, several JFK8 workers walked out and called on Amazon to take steps to protect those inside the warehouse where positive cases were known but not always being reported to employees.
This Workers Memorial Day, policymakers should listen to and follow the lead of workers at Amazon and elsewhere who are organizing to build the power necessary to demand safe work, often in the face of long odds and intense employer union-busting. With pandemic losses still mounting and untold numbers of worker deaths to mourn, it’s past time to ensure effective regulation of workplace safety and the protection of all workers’ rights to form a union.
Stagnant top-code thresholds threaten data reliability for the highest earners and make inequality difficult to accurately measure
Measuring wage growth, particularly at high wage levels, has become a difficult task. The most useful, publicly-available data for measuring trends in hourly wages is the Current Population Survey (CPS). Analyses from CPS, for example, (like this one here) are a key reason why we know that except for brief periods of decent wage growth for middle- or low-wage workers between 1979 and today, wage growth for most workers has been slow while wage growth for top earners has been far more rapid.
Unfortunately, it is increasingly difficult to report accurate data on top-end wages or wage changes using the CPS because of growing inequality and measurement issues related to top-coding, an earnings reporting method that hasn’t kept up with rising wages for top earners and thus limits measuring of earnings above a certain threshold (and therefore makes it difficult to accurately measure average wages as well). “Top codes” used in the CPS assign observations that report wages over some threshold the identical “top-coded” value in the data (the current top code is $2,884.61 in weekly wages). The top code is not updated annually for inflation or anything else. Consequently, it suppresses a larger and larger fraction of the CPS data over time. If wage-growth for workers who make more than the top code has been systematically faster than for workers beneath the top code, we will miss out on just how much wage inequality has risen.
This creates a real problem for assessing overall trends in inequality, because so much income (including wage income) has been concentrated at the very top of distributions. For example, data on annual wage growth from the Social Security Administration that is not top coded show substantially more dramatic growth in inequality than what is apparent in CPS data (see an analysis of this SSA data here). Given that the overwhelming majority of high-wage workers work full-time, it is surely the case that the SSA data for the highest-paid workers is mostly representative of very rapid growth in hourly wages, not hours worked. Yet we cannot really validate this with direct measures of hourly wages available to use in the CPS.
Aside from the problems it presents for interpreting overall trends in inequality, the CPS top code has radically different implications for analyses of smaller demographic groups. At the Economic Policy Institute (EPI), we provide labor market and wage analysis on our State of Working America Data Library page based on the best available data. When we attempt to analyze wages among demographic groups, by gender, race/ethnicity, and/or education, the parts of the wage distribution we are able to measure is even smaller because more and more observations’ data are suppressed by the top code.
The failure to adjust the top code to better capture wages at the high end isn’t a new phenomenon. Between 1973 and 1988, the top code for weekly earnings was constant in nominal dollars at $999 per week, even as inflation ran in double-digits over some of the intervening years. Then, it stayed at $1,923 per week between 1989 and 1997. The latest change in the top code was made back in 1998; the current top code has now sat at $2,884.61 per week in nominal value for the last twenty four years. Even if wages did not grow in real terms and only kept up with inflation, the ability to measure high end wages would be compromised. But, in most years, high end wages grew far faster than inflation, increasing the pace at which wages could not be reliably measured.
The Census Bureau has announced upcoming changes to the top-coding procedure for usual weekly earnings and usual hourly earnings data, which will certainly improve data analysis moving forward. But, there has been no indication that data will be changed historically, which does not solve the problem of trying to uncover high end earnings trends over the last few decades.
We start our display of the top-code issue with an examination of the shares of each demographic group that have been top-coded over time. Figure A displays top-coding shares overall as well as by gender from 1979 to 2021. Figure B displays the same for White, Black, Hispanic, and Asian American and Pacific Islander (AAPI) workers. And, Figure C displays the same trends by educational attainment.
Figure A illustrates the difficulties in measuring between and within group inequality at the high end of the wage distribution resulting from a significant portion of men being top-coded. This is particularly noticeable during 1985–1988 and 2018–2021. The share of men who were top-coded increased sharply through the 1980s, exceeding 5% of workers between 1986 and 1988, and then reached an all-time high of 7.7% in 2021. The higher shares of men top-coded compared with women is not surprising given the fact that they are far more likely to be found in higher paying jobs in the U.S. economy while women continue to face a significant gender pay gap, particularly at the middle and upper portion of the wage distribution, even among women with higher levels of educational attainment.
The top 5% of men’s wages have been topcoded in 8 of the last 43 years: Topcode shares by overall and gender, 1979–2021
| Year | All | Men | Women |
|---|---|---|---|
| 1979 | 0.6% | 1.0% | 0.1% |
| 1980 | 0.7% | 1.2% | 0.1% |
| 1981 | 1.0% | 1.8% | 0.1% |
| 1982 | 1.4% | 2.5% | 0.2% |
| 1983 | 1.8% | 3.3% | 0.3% |
| 1984 | 2.3% | 3.9% | 0.4% |
| 1985 | 2.7% | 4.7% | 0.6% |
| 1986 | 3.2% | 5.5% | 0.7% |
| 1987 | 3.7% | 6.4% | 0.9% |
| 1988 | 4.5% | 7.4% | 1.1% |
| 1989 | 0.5% | 0.8% | 0.1% |
| 1990 | 0.6% | 1.0% | 0.1% |
| 1991 | 0.7% | 1.2% | 0.2% |
| 1992 | 0.7% | 1.3% | 0.2% |
| 1993 | 0.8% | 1.4% | 0.2% |
| 1994 | 1.2% | 2.0% | 0.4% |
| 1995 | 1.3% | 2.2% | 0.4% |
| 1996 | 1.4% | 2.3% | 0.4% |
| 1997 | 1.7% | 2.6% | 0.6% |
| 1998 | 0.6% | 1.0% | 0.2% |
| 1999 | 0.7% | 1.1% | 0.2% |
| 2000 | 0.8% | 1.3% | 0.3% |
| 2001 | 0.9% | 1.4% | 0.3% |
| 2002 | 1.0% | 1.6% | 0.4% |
| 2003 | 1.1% | 1.6% | 0.4% |
| 2004 | 1.2% | 1.9% | 0.4% |
| 2005 | 1.3% | 2.0% | 0.5% |
| 2006 | 1.5% | 2.3% | 0.6% |
| 2007 | 1.7% | 2.6% | 0.7% |
| 2008 | 1.9% | 3.0% | 0.9% |
| 2009 | 2.1% | 3.2% | 0.9% |
| 2010 | 2.3% | 3.4% | 1.0% |
| 2011 | 2.3% | 3.4% | 1.1% |
| 2012 | 2.6% | 3.9% | 1.2% |
| 2013 | 2.8% | 4.2% | 1.4% |
| 2014 | 2.9% | 4.2% | 1.5% |
| 2015 | 3.2% | 4.6% | 1.6% |
| 2016 | 3.5% | 4.9% | 1.7% |
| 2017 | 3.7% | 5.1% | 2.0% |
| 2018 | 4.2% | 6.0% | 2.3% |
| 2019 | 4.6% | 6.3% | 2.6% |
| 2020 | 5.4% | 7.4% | 3.2% |
| 2021 | 5.8% | 7.7% | 3.5% |
Notes: The topcode nominal dollar thresholds for weekly earnings have been updated three times since 1973. The topcode value was $999 from 1973–1988, $1923 from 1989–1997, and has currently sat at $2,884.61 since 1998.
Source: Authors’ analysis of EPI Microdata Extracts.
Figure B makes apparent how the historical and current discrimination against Black and Hispanic workers has meant that they are less likely to be in higher paying jobs, thus leading them to have significantly lower shares of top-coded workers than their AAPI and white counterparts. Between 1979 and 1997, the share of Black and Hispanic workers who were top-coded did not exceed 1.6% for either group, while “other” (largely AAPI) workers and white workers’ shares hit 4.8% and 5.1%, respectively. After the top-code threshold was reset in 1998, Black and Hispanic shares remained low until the last couple of years, hitting 2.5% and 2.6%, respectively. At the same time, AAPI and white workers experienced significant increases in the shares of their workforce hitting the top code, 10.9% and 6.8%, respectively. Ultimately, the significant increase in top-code shares among AAPI and white workers makes measuring the true high-end wage inequality within and across racial and ethnic groups nearly impossible; in fact, it also makes calculating average wages more challenging—relying more heavily on imputation assumptions—if the upper end is increasingly top-coded.
Earnings at the top for AAPI and white workers have been impossible to accurately measure since the mid 2010s: Topcode shares by race/ethnicity, 1979–2021
| Year | White | Black | Hispanic | AAPI | Other |
|---|---|---|---|---|---|
| 1979 | 0.6% | 0.1% | 0.1% | 0.4% | |
| 1980 | 0.8% | 0.1% | 0.3% | 0.7% | |
| 1981 | 1.2% | 0.2% | 0.4% | 1.0% | |
| 1982 | 1.6% | 0.3% | 0.4% | 1.9% | |
| 1983 | 2.1% | 0.5% | 0.6% | 2.0% | |
| 1984 | 2.6% | 0.7% | 0.7% | 2.0% | |
| 1985 | 3.1% | 0.8% | 0.9% | 2.5% | |
| 1986 | 3.7% | 0.8% | 1.1% | 3.8% | |
| 1987 | 4.3% | 1.2% | 1.2% | 4.3% | |
| 1988 | 5.1% | 1.6% | 1.4% | 4.8% | |
| 1989 | 0.6% | 0.0% | 0.2% | 0.4% | 0.4% |
| 1990 | 0.7% | 0.1% | 0.2% | 0.8% | |
| 1991 | 0.8% | 0.1% | 0.2% | 0.9% | |
| 1992 | 0.9% | 0.1% | 0.1% | 1.1% | |
| 1993 | 1.0% | 0.2% | 0.2% | 0.9% | |
| 1994 | 1.4% | 0.5% | 0.4% | 1.4% | |
| 1995 | 1.6% | 0.3% | 0.4% | 1.6% | |
| 1996 | 1.7% | 0.4% | 0.5% | 1.8% | |
| 1997 | 2.0% | 0.5% | 0.5% | 2.4% | |
| 1998 | 0.8% | 0.2% | 0.2% | 0.6% | |
| 1999 | 0.9% | 0.2% | 0.2% | 0.7% | |
| 2000 | 1.0% | 0.3% | 0.3% | 1.1% | |
| 2001 | 1.1% | 0.3% | 0.2% | 1.3% | |
| 2002 | 1.3% | 0.2% | 0.3% | 1.4% | |
| 2003 | 1.3% | 0.3% | 0.3% | 1.3% | |
| 2004 | 1.4% | 0.3% | 0.5% | 1.7% | |
| 2005 | 1.6% | 0.3% | 0.4% | 1.6% | |
| 2006 | 1.9% | 0.4% | 0.4% | 2.1% | |
| 2007 | 2.1% | 0.6% | 0.5% | 2.2% | |
| 2008 | 2.4% | 0.7% | 0.7% | 2.8% | |
| 2009 | 2.5% | 0.8% | 0.8% | 2.6% | |
| 2010 | 2.8% | 0.8% | 0.9% | 3.0% | |
| 2011 | 2.8% | 1.0% | 0.8% | 3.2% | |
| 2012 | 3.2% | 1.1% | 0.9% | 3.9% | |
| 2013 | 3.4% | 1.1% | 1.0% | 4.1% | |
| 2014 | 3.5% | 1.2% | 1.0% | 4.6% | |
| 2015 | 3.9% | 1.4% | 1.3% | 5.3% | |
| 2016 | 4.2% | 1.6% | 1.3% | 5.9% | |
| 2017 | 4.5% | 1.6% | 1.4% | 6.2% | |
| 2018 | 5.2% | 1.8% | 1.6% | 6.6% | |
| 2019 | 5.5% | 2.1% | 1.9% | 8.3% | |
| 2020 | 6.4% | 2.4% | 2.3% | 10.3% | |
| 2021 | 6.8% | 2.6% | 2.5% | 10.9% | |
Notes: The topcode nominal dollar thresholds for weekly earnings have been updated three times since 1973. The topcode value was $999 from 1973–1988, $1923 from 1989–1997, and has currently sat at $2,884.61 since 1998. AAPI refers to Asian American and Pacific Islander. Race/ethnicity categories are mutually exclusive (i.e., white non-Hispanic, Black non-Hispanic, AAPI non-Hispanic, and Hispanic any race). Prior to 1989, AAPI was not reported separately and included in “Other.”
Source: Authors’ analysis of EPI Microdata Extracts.
Figure C demonstrates how higher levels of educational attainment are related to higher earnings. There is a consistent and significant gap between the top-code share of workers with an advanced or college degree and those with the next highest level of educational attainment (some college experience). In 1988, 20.1% of workers with an advanced degree were top-coded, while the same was true for 11.0% of workers with a college degree. The share of workers with some college experience who were top-coded was only 2.9%. This large gap persisted in 2021, with the top-code shares being 17.0% and 9.3% for workers with an advanced and college degree respectively while workers with some college experience had only 1.9% top-coded. The significant shares of top-coded workers within the advanced degree and college educational attainment groups increases the difficulty of measuring their wages both alone, and in comparison, to other groups.
Advanced degree holders' wages exceed 5% topcode share in all but 10 years since 1979: Topcode shares by education, 1979–2021
| Year | Less than high school | High school | Some college | College | Advanced degree |
|---|---|---|---|---|---|
| 1979 | 0.1% | 0.2% | 0.4% | 1.6% | 3.3% |
| 1980 | 0.1% | 0.2% | 0.5% | 2.1% | 3.8% |
| 1981 | 0.2% | 0.4% | 0.7% | 3.1% | 5.1% |
| 1982 | 0.2% | 0.4% | 0.8% | 4.0% | 7.3% |
| 1983 | 0.3% | 0.5% | 1.1% | 5.1% | 9.1% |
| 1984 | 0.3% | 0.7% | 1.5% | 6.1% | 11.2% |
| 1985 | 0.4% | 0.9% | 1.9% | 6.8% | 13.0% |
| 1986 | 0.3% | 1.0% | 2.2% | 8.3% | 15.3% |
| 1987 | 0.4% | 1.1% | 2.6% | 9.6% | 17.6% |
| 1988 | 0.6% | 1.4% | 2.9% | 11.0% | 20.1% |
| 1989 | 0.0% | 0.1% | 0.3% | 1.1% | 2.7% |
| 1990 | 0.1% | 0.1% | 0.3% | 1.3% | 3.4% |
| 1991 | 0.0% | 0.1% | 0.3% | 1.5% | 4.3% |
| 1992 | 0.0% | 0.1% | 0.3% | 1.7% | 4.5% |
| 1993 | 0.0% | 0.1% | 0.3% | 1.8% | 5.1% |
| 1994 | 0.2% | 0.3% | 0.5% | 2.7% | 6.8% |
| 1995 | 0.1% | 0.2% | 0.5% | 2.9% | 7.7% |
| 1996 | 0.1% | 0.2% | 0.6% | 3.0% | 7.8% |
| 1997 | 0.1% | 0.4% | 0.7% | 3.6% | 8.9% |
| 1998 | 0.1% | 0.1% | 0.3% | 1.3% | 3.3% |
| 1999 | 0.1% | 0.1% | 0.2% | 1.6% | 3.7% |
| 2000 | 0.0% | 0.1% | 0.3% | 1.8% | 4.1% |
| 2001 | 0.1% | 0.1% | 0.3% | 2.1% | 4.2% |
| 2002 | 0.1% | 0.2% | 0.4% | 2.2% | 4.9% |
| 2003 | 0.1% | 0.2% | 0.4% | 2.3% | 4.8% |
| 2004 | 0.1% | 0.3% | 0.4% | 2.3% | 5.7% |
| 2005 | 0.1% | 0.2% | 0.5% | 2.6% | 5.9% |
| 2006 | 0.1% | 0.3% | 0.5% | 2.9% | 6.9% |
| 2007 | 0.1% | 0.3% | 0.6% | 3.3% | 7.3% |
| 2008 | 0.1% | 0.5% | 0.7% | 3.6% | 8.0% |
| 2009 | 0.2% | 0.4% | 0.7% | 3.7% | 8.9% |
| 2010 | 0.2% | 0.5% | 0.7% | 4.2% | 8.9% |
| 2011 | 0.2% | 0.5% | 0.8% | 4.1% | 8.9% |
| 2012 | 0.2% | 0.5% | 0.7% | 4.6% | 10.5% |
| 2013 | 0.2% | 0.5% | 0.8% | 5.0% | 10.6% |
| 2014 | 0.2% | 0.6% | 0.9% | 5.0% | 10.6% |
| 2015 | 0.3% | 0.8% | 1.2% | 5.5% | 10.9% |
| 2016 | 0.2% | 0.7% | 1.0% | 6.1% | 11.9% |
| 2017 | 0.4% | 0.8% | 1.0% | 6.4% | 12.3% |
| 2018 | 0.4% | 1.0% | 1.3% | 6.8% | 14.1% |
| 2019 | 0.4% | 1.0% | 1.4% | 7.5% | 14.8% |
| 2020 | 0.4% | 1.2% | 1.8% | 8.4% | 16.3% |
| 2021 | 0.5% | 1.2% | 1.9% | 9.3% | 17.0% |
Notes: The topcode nominal dollar thresholds for weekly earnings have been updated three times since 1973. The topcode value was $999 from 1973–1988, $1923 from 1989–1997, and has currently sat at $2,884.61 since 1998.
Source: Authors’ analysis of EPI Microdata Extracts.
Of course, the difficulties of measuring high end earnings are even more acute when we look at demographic groups that cut across gender, race/ethnicity, and education.
Figure D makes the power of intersectionality evident. Workers who identify with the groups with the largest top-code shares across gender, race, and education have earnings which are by far the most difficult to measure. Men (7.7%), AAPI workers (10.9%), and those with advanced degrees (17.0%) have the largest top-code shares of their respective demographic groups. However, when you examine these demographics in combination, AAPI men with advanced degrees, the share of workers who are top-coded is even more significant (29.2%). The group with the second largest top-code shares across all combinations of gender, race, and education are white men with advanced degrees (25.6%). For these groups, and all those displayed in Figure D, high-end earnings are exceedingly difficult to measure due to large top-code shares.
For some demographic groups, even 85th percentile wages are not measurable: Topcode shares for specific groups, 2021
| Share for specific groups | |
|---|---|
| All | 5.8% |
| White women, advanced degree | 10.1% |
| AAPI men, college degree | 13.1% |
| White men, college degree | 14.9% |
| AAPI women, advanced degree | 15.1% |
| Black men, advanced degree | 15.6% |
| Hispanic men, advanced degree | 18.8% |
| White men, advanced degree | 25.6% |
| AAPI men, advanced degree | 29.2% |
Notes: The topcode nominal dollar thresholds for weekly earnings have been updated three times since 1973. The topcode value was $999 from 1973–1988, $1923 from 1989–1997, and has currently sat at $2,884.61 since 1998. AAPI refers to Asian American and Pacific Islander. Race/ethnicity categories are mutually exclusive (i.e., white non-Hispanic, Black non-Hispanic, AAPI non-Hispanic, and Hispanic any race).
Source: Authors’ analysis of EPI Microdata Extracts.
See our State of Working America Data Library page for wages by percentile, including NA’s for percentile values that can’t be reliably measured.
It’s unfortunate that policy has not made a significant contribution to reining in rising wage inequality over these years. But allowing rising inequality to mechanically obscure even its own measurement seems truly absurd, and yet extremely easy to fix. The BLS should commit to higher and far more regularly updated top codes, or find some other way to allow researchers to get a clearer sense of what is happening to wage inequality than what the CPS currently allows.
Corporate profits have contributed disproportionately to inflation. How should policymakers respond?
The inflation spike of 2021 and 2022 has presented real policy challenges. In order to better understand this policy debate, it is imperative to look at prices and how they are being affected.
The price of just about everything in the U.S. economy can be broken down into the three main components of cost. These include labor costs, nonlabor inputs, and the “mark-up” of profits over the first two components. Good data on these separate cost components exist for the nonfinancial corporate (NFC) sector—those companies that produce goods and services—of the economy, which makes up roughly 75% of the entire private sector.
Since the trough of the COVID-19 recession in the second quarter of 2020, overall prices in the NFC sector have risen at an annualized rate of 6.1%—a pronounced acceleration over the 1.8% price growth that characterized the pre-pandemic business cycle of 2007–2019. Strikingly, over half of this increase (53.9%) can be attributed to fatter profit margins, with labor costs contributing less than 8% of this increase. This is not normal. From 1979 to 2019, profits only contributed about 11% to price growth and labor costs over 60%, as shown in Figure A below. Nonlabor inputs—a decent indicator for supply-chain snarls—are also driving up prices more than usual in the current economic recovery.
Child care and elder care investments are a tool for reducing inflationary expectations without pain
Inflation is by far the biggest economic concern facing the U.S. economy today. While job growth is historically rapid and survey evidence indicates that workers think now is the best time in years to find a good job, the inflation surge has kept this labor market strength from translating into higher wages and incomes for most households. The most well-known tool to restrain inflation—higher interest rates engineered by the Federal Reserve—is potentially very costly if it leads to higher unemployment and a weaker labor market.
Given all of this, policymakers should look for any tool that can help restrain inflationary pressures without causing significant collateral damage. One such tool could be investments in child care and elder care. By subsidizing families’ use of child care and elder care and providing direct investments to providers, such investments could boost future labor supply by allowing working-age parents and children who want to look for paid employment to do so while remaining confident their family members are receiving care. Further, these investments can help dampen inflationary pressures—that rising wages could in theory contribute to—even well before they fully take effect.
To understand why, one must realize that developments in the labor market will likely determine just how easily (or not) inflationary pressures can be lowered in the next year or so. The inflationary spike that began in 2021 didn’t start in the labor market—it started in commodities and in supply-chain-snarled durable goods sectors where wage growth was actually slower than in other parts of the economy. But going forward, whether or not the Federal Reserve needs to start applying ever-stronger medicine (with deeply damaging side effects) to slow inflation depends on what happens in labor markets. Specifically, it depends on whether or not the initial inflationary shock leads to unsustainably large wage increases that push up inflation even further, leading to wage-price spirals of the sort that characterized the 1970s.
March jobs report shows strong growth as the labor market continues to recover at a rapid pace
Below, EPI economists offer their initial insights on the jobs report released this morning, which showed 431,000 jobs added in March.
Job Openings and Labor Turnover Survey: Job openings were little changed while hires edged up
Below, EPI senior economist Elise Gould offers her initial insights on today’s release of the Job Openings and Labor Turnover Survey (JOLTS) for February. Read the full Twitter thread here.
The hires and quits rates have been moving in the same general direction for months. They both ticked up slightly in February. Workers continue to quit and get hired at fast rates in today’s economy, including the hires of workers returning/entering the labor market. pic.twitter.com/erHPkXA7aV
— Elise Gould (@eliselgould) March 29, 2022