Incomes and Poverty Stable as Wage Stagnation Continues
Modest income growth in 2012 barely begins to offset lost decade driven by financial crisis and decade-long wage stagnation
This morning, the Census Bureau released its report on income, poverty, and health insurance coverage in 2012. It shows that from 2011 to 2012, median household income for non-elderly households (those with a head of household younger than 65 years old) increased 1.0 percent from $56,802 to $57,353. However, that modest growth barely begins to offset the losses incurred during the Great Recession. Between 2007 and 2011, median household income for non-elderly households dropped from $62,617 to $56,802, a decline of $5,815, or 9.3 percent. Furthermore, the disappointing trends of the Great Recession and its aftermath come on the heels of the weak labor market from 2000-2007, where the median income of non-elderly households fell significantly, from $64,843 to $62,617, the first time in the post-war period that incomes failed to grow over a business cycle. Altogether, from 2000 to 2012, median income for non-elderly households fell from $64,843 to $57,353, a decline of $7,490, or 11.6 percent.
5 Years Later: The Crisis We Averted and the One We Didn’t
Brad DeLong recently wrote an excellent piece contrasting the “Banking Versus Macroeconomics” camps in assessing how the U.S. responded to the financial crisis that peaked with the uncontrolled bankruptcy of Lehman five years ago. A quick summary:
“One camp, call it the Banking Camp, sees a central bank as a bank for bankers: its clients are the banks…and its functions are to support the banking sector and …to ensure that there is enough credit and liquidity in the economy that mere illiquidity rather than insolvency does not force banks into bankruptcy and liquidation.
Another camp, call it the Macroeconomic Camp, sees a central bank… as the steward of the economy as a whole, with its primary responsibility not to preserve the health of the businesses that make up the banking sector but rather to maintain the health of the economy as a whole.”
This is a useful dichotomy, and one that can help explain differing assessments of how policymakers responded to the Global Financial Crisis of 2007/08.
Flawed Diagnoses and Inappropriate Cures in Education
I don’t mean to pick on Joel Klein, the former New York City schools chancellor, but he has made himself such a caricature of self-styled school reformers who are undermining American public education that it would be a mistake not to respond to the claims on which he bases his efforts.
Last year, I addressed Mr. Klein’s conclusion that public education must be failing because he himself grew up in public housing as a “kid of the streets,” yet owed his success to great public schools; and if only children from public housing projects today had schools as good as his, they too would be successful.
The analysis, it turned out, was misleading. The New York City public housing in which the Klein family lived in the 1950s was segregated, constructed for white middle class two-parent households where the husband had a stable employment history and where market rents were charged with no public subsidy. Such housing projects no longer exist, and the conditions in which Joel Klein grew up bear no resemblance to those from which minority children in impoverished families come to school today.
Mayor Gray’s statement in support of his veto of the LRAA should embarrass him
Vincent Gray’s statement in support of his veto of the Local Retailer Accountability Act was a collection of non-sequiturs, half-truths, vague promises, and nonsense. He divides his critique of the LRAA into six sections.
- “The bill is not a living wage bill because it would raise the minimum wage only for a small fraction of the District’s workforce.” The Mayor says he wants, instead, “to raise the minimum wage for all District residents.” Of course, the District could do both: require a higher minimum wage for billion-dollar corporations and a lower one for other businesses, including mom and pop stores. But the fact is that Mayor Gray hasn’t put forward any minimum wage increase, and the level that Councilmember Tommy Wells has suggested is $10.25—far below a “true living wage.” Each member of a 2-parent family with two kids would need to earn nearly $20 an hour to have a true living wage in the District.
- “The bill is a job killer, because nearly every large retailer now considering opening a store in the District has indicated they will not come here or expand here if this bill becomes law.” The Mayor should identify the expansions Target, Home Depot, Wegmans, Lowe’s, Walgreens, Harris Teeter, AutoZone and Macy’s will make if the bill doesn’t pass. If they have such plans, why haven’t they announced them? And how credible is this threat? What billion-dollar retailer would invest here with a minimum wage of $10.25 an hour but not with a minimum wage of $12.50 that gives a credit for other benefits? The Mayor is either being dishonest, or gullible, or is simply unwilling to stand up to corporate bullies.Read more
What We Read Today
Here’s what we read today. Did we miss anything good? Let us know in the comments.
- Why Janet Yellen, Not Larry Summers, Should Lead the Fed (New York Times)
- How High 401(k) Fees Can Doom Your Retirement Plans (Slate)
- Dying Not Under a Bridge, Nor Living in an E.R. (The Atlantic)
- Public Universities Funding Less Low-Income Students Nationwide (Color Lines)
- Carwash Workers and Capitol Hill: Immigration in Limbo (In These Times)
- At Grandmother’s House We Stay (Pew Research)
- Problem of unpaid internships in Ontario is ‘massive,’ says student group (Toronto Star)
- Wynne Godley’s Crucial Warnings About the Trade Deficit Still Ignored (AmericanEconomistAlert.org)
Social Welfare Spending, Part II: Looking Forward—It’s Still All About Health Costs
If House Republicans were at all serious last July, then they should be putting the finishing touches on their “menu” of social welfare spending cuts that they plan to force the president to choose from in exchange for an increase in the debt limit. Presumably, with this “menu,” a large increase in the debt ceiling would require a large reduction in social welfare spending while a small debt ceiling increase would require a smaller spending cut. This means that House Republicans are again preparing to risk America’s credit rating to eviscerate important and popular programs such as Social Security and Medicare.
I recently showed that the rise in social welfare spending since 1975 was due to: (1) the steady rise in federal health spending, driven in large part by increasing costs in the private-sector delivery of health care goods and services, and (2) the jump in safety net spending during the 2007-2009 Great Recession as programs like unemployment compensation and SNAP expanded (both because the recession pushed more people into eligibility and because Congress temporarily expanded the programs to blunt the impact of the downturn). Social welfare spending has fallen relative to GDP in the past couple of years as the economy slowly recovers, yet the unemployment rate is still over 7 percent, nearly 40 percent of the unemployed have been looking for work for over 6 months, and the labor force participation rate is at a 35 year low.
ACA Implementation Advice: Encourage Timely Reports Of Income Changes
In a recent Health Affairs article, we, along with coauthor Dave Graham-Square, examine a potential pitfall in the design and implementation of the tax subsidies individuals and families may receive through the new health insurance marketplaces beginning in 2014. Next month, eligible Americans will be able to apply for subsidies to purchase health insurance in the new state and federally facilitated insurance exchanges. The amount of subsidy is determined by a person or family’s income over the past year. A problem may arise at the end of the year if income changes substantially and the family’s subsidy levels are not adjusted accordingly. Families may owe large sums at tax time if the subsidies aren’t recalculated as income rises.
Our article examines the extent to which eligible families in California experience income changes, which could have substantial effects on their subsidy levels. Using two-year panels of the Survey of Income and Program Participation (SIPP), matched to the California Simulation of Insurance Markets (CalSIM), we construct the projected demographic profile and participation of the state’s subsidized exchange population in 2018 to 2019.
2012 Income Numbers: What to Expect Next Tuesday and Why It Matters
Next Tuesday, the 2012 income numbers will be released by the Census Bureau and will reveal whether or not U.S. households have begun to dig out of the hole left by the Great Recession.
Between 2007 and 2011, median household income dropped by 8.1 percent (Excel file). Unfortunately, Tuesday’s numbers are unlikely to show much of a rebound for the median household in 2012.
Two things that will have pushed the income numbers in a positive direction are average weekly hours worked, which increased by 0.3 percent in 2012, and the share of the population that is employed, which grew by 0.3 percent when considering the entire 16+ population and 0.8 percent when considering just “prime-age” workers (workers age 25-54). However, those increases will be at least partially offset by the fact that due to the weak labor market, workers were earning less per hour in 2012 than they did in 2011. (Real hourly wages for the median worker dropped by 0.6 percent in 2012.) Putting these factors together, my back-of-the-envelope calculation is that, in 2012, median household income likely grew somewhere between zero percent and one-half of one percent.
Top 1 Percent Receive Record High Share of Total U.S. Income
The United States has experienced increasing economic inequality since the late 1970s. New data released this week confirm that the Great Recession was only a blip on the road toward growing income inequality. Emmanuel Saez and Thomas Piketty updated their now-famous data on cash, market-based income, allowing one to track trends in inequality in the United States between 1913 through 2012.
As illustrated in the graph below, the share of income going to the top 1 percent has surpassed its 2007 peak of 18.3 percent and is now 19.3 percent—the highest share since 1928.
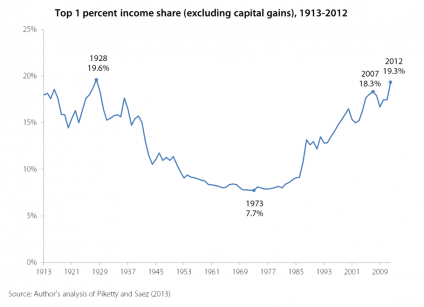
At the same time, the Piketty and Saez data show that the Great Recession has battered incomes for the bottom 90 percent so badly that they are now back to the same levels that prevailed in 1966.
Entitlement Spending, Part I: Looking Back
It was reported earlier this summer that congressional Republicans planned on demanding that the Obama administration choose from a “menu” of mandatory spending cuts in exchange for raising the country’s statutory debt limit. “Mandatory spending” (or the even less flattering “entitlements”) is a budget wonk’s way of referring to programs such as Social Security, Medicare and Unemployment Compensation as well as for important programs for low-income individuals and families such as Medicaid, the Supplemental Nutrition Assistance Program (SNAP, formerly known as food stamps), and Supplemental Security Income (SSI, a means-tested benefit for the low-income blind, disabled, and elderly).
Before looking ahead at some of the specific proposals for “entitlement reform,” it is instructive to look back at spending on these programs in recent decades to see which have been growing and which have not, and to examine the sources of this growth. The GOP narrative, after all, on why these popular programs must be cut is that they are allegedly spiraling out of control. This post examines whether or not there’s any evidence for this view.
Workers’ Pay Hasn’t Always Lagged Productivity Growth
In a recent blog post, we introduced a calculator showing how much higher your wages (for a stylized definition of “your”—more on this below) could be if they had kept pace with economy-wide productivity, defined as economic output produced in a given hour of work. Why is this relationship between wages and productivity interesting? Well, for decades following World War II, wages across the board closely tracked productivity. In recent decades, however, while average wages (almost) track productivity growth, wages for the vast majority of Americans have not. So, telling people what this wedge between productivity and wage-growth means in dollar terms seems like a useful way to make rising inequality less abstract and more salient.
The calculator itself is pretty spare, so I figured I’d take this blog post to explain a little more about our methods. First, we constructed the actual wage distribution for 2012 by using the BLS’s CPS-ORG data (Bureau of Labor Statistics Current Population Survey Outgoing Rotation Group).
Next, when somebody inputs their own wage into the calculator, we use this 2012 distribution to figure out where they fall in the overall wage distribution. Specifically, we are looking at where that wages falls with respect to the ventile cuts in that distribution—that is, for instance, between the 55th and 60th percentile of the wage distribution. Next, we look at that same point in the wage distribution of 1979.
What We Read Today
What we read today, as well as some good pieces from Labor Day:
- Detroit, Labor Day and a Hard Day’s Night (The Hill)
- The STEM Crisis Is a Myth (Spectrum)
- Hispanic College Enrollment Surges in 2012 (Census.gov)
- Labor, Then and Now (New York Times)
- Why business needs a stronger labor movement (MSNBC)
How Much We Have Backslid
The nation has made great progress in race relations in the last 50 years. But in some respects, we’ve gone backwards, and we continue to do so.
A case in point is a Wednesday interview with U.S. Secretary of Education Arne Duncan on NPR’s Diane Rehm Show.
Host Susan Page asked the secretary about his views on racial integration. I was a panelist on the program, and was asked to comment.
Ms. Page’s specific question concerned a lawsuit in Louisiana. This is what Secretary Duncan said about the broader issue of racial integration:
“I fundamentally think the need for integration and more integrative schools is very real, and there are things that we can do. Obviously, there are housing patterns that present challenges.… But I was fortunate to go to an integrated school, you know, all the way through K-12.
And I don’t think I could do a job like this was I not, you know, didn’t have that kind of opportunity. And far too many children today are denied that opportunity. So, yes, we want to do everything to make sure they’re, you know, getting rigorous course work and have great teachers and are academically prepared for college. But you want children to grow up comfortable and confident with other people who come from different backgrounds from them.
And if they don’t have those opportunities—not that you can’t learn it as an adult, but it’s much harder. So whatever we can do to continue to increase integration in a voluntary way—I don’t think you could force these kinds of things—we want to be very, very thoughtful and to try to do more in that area quite frankly.”
It was a shocking statement in two respects, but typical of how even many liberals who claim to support racial justice today think of integration.
Mayor Gray Should Sign the Large Retailer Accountability Act
Washington, DC, Mayor Vincent Gray has not announced a decision yet on whether he will veto the bill to require big, billion-dollar retailers to pay a fair wage to their employees in the District of Columbia. The writing seems to be on the wall, however, given that Gray’s deputy mayor for planning and economic development, Victor Hoskins, is holding the bill up as a “job killer.”
Why is a bill that requires total compensation far below the national median wage ($16.30) considered a job killer? The Large Retailer Accountability Act would require the biggest retailers to pay $12.50 an hour in total compensation (wages and benefits), barely more than the federal poverty income threshold of $23,550 for a family of four and nowhere near what it costs to live in the District. The LRAA is flexible and permits a lower wage: it would permit an $11.50 an hour wage, for example, if the business paid other benefits like health care or a pension contribution that equaled at least $1.00. How is that a job killer for a billion dollar corporation? Well, it just is, says Walmart, which has threatened to abandon plans for three new stores in DC if the bill is enacted.
For politicians, the prospects of visible new jobs (no matter how poorly they pay) are almost irresistible, so any threat to the three Walmart stores, however much it smacks of bullying and exploitation, makes some of them blind to the other implications of Walmart jobs paying about $8.90 an hour.
What to Watch on Jobs Day: Public Sector Job Growth
In last month’s jobs report, virtually every indicator demonstrated that, more than four years since the official end of the Great Recession, we have not yet entered a robust jobs recovery. That main point will not change when the August numbers are released on Friday; we will very likely see a continuation of these troubling labor market trends that persist due to weak hiring.
Additional Indicator to Watch: It is possible that the public sector will have added jobs in August. If so, this would be the second month in a row of gains (in July, the public sector added 1,000 jobs). This would represent an important step in the right direction—jobs losses in the public sector have been an enormous drain on the recovery. However, it’s useful to keep in mind just how large a public-sector jobs hole in the economy faces. Since the recovery began in June 2009, the public sector has lost 733,000 jobs. Public sector employment should naturally grow as the population grows. To keep up with population growth over this period, public sector employment should have increased by around 680,000.
Budget Debates Matter: The Difference in GOP and Democratic Levels of Discretionary Spending for 2014 Translates into Nearly 1 Million Jobs
Americans probably have a vague sense (and dread) that Washington will once again be preoccupied with budget issues this fall. Debates over the budget get airy and general very quickly, so it’s useful to focus on some key, specific issues that actually matter. One of these real issues—one that matters a lot for the pace of economic recovery—is the level of discretionary spending that will be agreed to in the “continuing resolution” for fiscal year 2014.
The current fiscal year ends September 30, so some arrangement to fund the federal government after this date must be arranged. But because prospects for agreeing on any substantive change to spending priorities is so dim, the assumption is that a “continuing resolution” will be passed that simply funds the government at levels currently called for under law.
But even this budget auto-pilot approach will not be uncontroversial, and the major sticking point regards discretionary spending levels for 2014.
What Should You Be Earning?
In honor of Labor Day, we made a little tool—based on our project inequality.is—that shows how much you would be making if wages had kept pace with productivity, a key indicator of an economy working for all.
Economic inequality is a real and growing problem in America. Since the 1979, workers are working more, making more goods, and not reaping the rewards of their increased productivity. Instead, CEOs and executives—the top 1% of earners—now take home 20% of the nation’s income.
But it doesn’t have to be like this. Growing inequality isn’t an inevitability—it was created. It’s the result of intentional policy decisions on taxes, trade, labor, and financial regulation. But that’s the good news: if inequality is not inevitable, then it can be fixed.
Take a look, and share with your friends. And remember that American workers should be earning more than we are. To do something about it, visit inequality.is.
[epi-wagecalculator]
Economy Boosting Jobs
Last week, Dylan Matthews wrote that, “You can always rely on the Economic Policy Institute for really depressing charts about just how far behind the U.S. middle class is falling.” In an attempt to show our positive side, here’s a new video, from our friends at the Topos Partnership, that explains the economy in terms everyone can understand.
The video makes the case that helping low wage workers helps everyone, and it does it without depressing charts or regression analyses. Given that today’s weak labor market is due to a severe demand shortage, raising wages at the bottom and middle can indeed boost economy-wide demand. When the economy is closer to full-employment, raising wages at the bottom and middle may not necessarily lead to higher GDP, but increasing the minimum wage and strengthening labor standards creates a floor that raises living standards for everyone. That, to us, is the very definition of a better-working economy.
EPI Family Budgets: Why More Tools Are Better Than One
NPR’s Planet Money had a good story this week about problems with the official measure of poverty, noting the general consensus among academics, researchers, and policy analysts alike that the federal poverty line has some fundamental flaws.
For one, the poverty line doesn’t take into account geographic differences—ignoring the widely varying regional prices for necessities like rent and child care. In New York City for example, where Marion Matthews, the single mom in the NPR story lives, rent and child care for a one-adult-one-child family can cost $2,544 per month, but only costs $923 per month in Simpson County, Mississippi.
Furthermore, the federal poverty line is calculated using a method that is obsolete given recent and historical trends in the U.S. economy. The current methodology was designed in 1963, and it basically set the poverty line at three times the cost of a basic food budget. Since then, the line has been only updated to account for overall inflation. Thus, for example, it doesn’t accurately reflect the increasing share of family budgets going towards housing and health care and the decreasing share going to food.
Besides these problems in calculating the right threshold for poverty, the current methodology does not account for resources that help raise living standards, such as food stamps and tax credits.
Broken Promises and Continuing Worker Abuses as Apple and its Suppliers Miss Deadline
On February 13, 2012, Apple announced that it would be relying on inspections by the Fair Labor Association as a path to ending labor rights abuses in its supply chain, leading to front page coverage in the New York Times. Six weeks later the FLA released a report documenting a range of serious labor rights violations at three Foxconn factories making Apple products, most of them previously reported by independent investigators whose findings Apple had largely ignored. Apple, Foxconn and the FLA pledged that these violations would be addressed through reforms to be implemented by July 2013.
That deadline has now passed, strangely unremarked upon by Apple and its chosen labor rights monitor, and Apple has not made good on its commitments. It is clear from interim verification reports by the FLA and from independent assessments that progress in Apple’s supply chain has fallen far short of the sweeping change promised early last year, particularly in the areas of unpaid compensation, inadequate wages, illegal overtime, violations of workers’ rights to freedom of association, and the scope of the reform efforts within Apple’s full (and massive) supply chain. The FLA’s August 2012 and May 2013 interim reports claimed great strides, but included concrete findings that often belied this positive spin (as we discussed here and here).
The FLA reports helped obscure a number of disturbing realities.
The Unfinished March Toward a Decent Minimum Wage
It was fifty years ago the March on Washington for Jobs and Freedom took place. The demand for a higher minimum wage was part of a package of demands seeking economic justice for workers through government intervention in the labor market. At that time, the wage floor was $1.15 and marchers were demanding a raise to $2.00. Today, that 50 year old demand would be worth about $13.39 when adjusted for price changes.
“To Work with Dignity” with my co-author Steven Pitts is the first in a series titled “The Unfinished March” that the Economic Policy Institute is releasing to review the demands, analyze the progress made, and determine the unfinished steps necessary to fully achieve each of the goals of the 1963 March.
Labor Department Should Crack Down on Illegal Unpaid Internships
Juliet Lapidos had a nice editorial in The New York Times on Saturday that took on the issue of unpaid internships—based on the recent news about Sheryl Sandberg’s Lean In foundation using Facebook to find a “part-time, unpaid” intern “with editorial and social chops” as well as “Web skills.” Lapidos reports that the ensuing uproar made the foundation reconsider and promise to pay the rather skilled employee they were looking for. Given that an estimated two-thirds of unpaid interns are women, and given that unpaid internships on average lead to much poorer employment prospects than do paid internships (fewer job offers and much lower salary offers), Lean In’s attempt to exploit this sketchy alternative to paid employment was embarrassing. The way to help young women get ahead is to pay them for their work, for their “editorial chops” and for their web skills, not to exploit them.
Lapidos made an important point about what’s needed to change the culture that makes this exploitation seem OK. A recent spate of lawsuits has brought the law to the attention of many employers for the first time, and it is dawning on some of them that there is a risk to cheating young workers out of the minimum wage. But interns looking for references for their resumes are unlikely to sue, and most cases–even if meritorious–don’t involve enough back pay to be worth a private lawyer’s time. What’s needed is energetic enforcement by the U.S. Department of Labor and the various state departments of labor. Very little effort would be required to make a difference. If investigators scanned Craigslist they could find plenty of cases to prosecute, and with appropriate publicity and media attention it wouldn’t take long for employers to catch on and clean up their act.
As Lapidos put it, “proper enforcement of labor law shouldn’t depend on exploited interns’ willingness to suffer through courtroom ordeals.” That’s what we pay government lawyers for.
Fifty Years Later: How Far Have We Marched?
The March on Washington fifty years ago was the first of many marches I would make: for civil rights; against one war, then another; against poverty; for women’s rights; for gun control; for the environment; and now back to celebrate the first.
They merge a bit in my memory. I’m not totally sure who all was with me at which event. I definitely remember sweltering in a suit and tie to help bring a white middle-class look to that first March for Jobs and Freedom.
I was inspired by King’s speech. But I was also inspired by practically everyone who spoke that day. To my young earnest policy wonk mind others seemed to be more on the specific agenda message than he was. Certainly I had no sense that his speech would be so historic. Nor that the March would be.
I was a volunteer foot soldier in Dr. King’s army: registering black voters in Virginia, picketing against discrimination in housing and hiring practices, helping get white faces to meetings and rallies. In 1965, I joined the march from Selma to Montgomery Alabama, where unlike the earlier Washington march, real fear walked with us.
This activism didn’t come naturally. I came from a family of white working poor—mostly indifferent to the oppression of the “Negroes.” We had our own problems paying the rent and putting food on the table. And, at least subconsciously, we were vaguely aware that the subjugation of black people kept us from joining them at the absolute bottom of the economic ladder.
Ignoring Cheap Ways to Boost Middle-Class Living Standards
David Autor and David Dorn had an op-ed in the NYT this weekend, outlining their case that technology has been the primary headwind for middle-class living standards over the past generation. We tend to have a different view; we think that the cumulative effect of economic policy decisions made over this time-span has been the real barrier to decent growth in middle-class living standards.
The first question lots of people have upon hearing this dispute is “does it actually matter?” Autor and Dorn accept (and document) just how rough a go it has been for middle-wage/middle-income workers and clearly accept that the rise in inequality that has seen rewards flow away from the middle-class is a problem that needs to be rectified. Who cares why they think it happened if they’re on-board with attempts to fix it?
The answer to this is simple and important: the diagnosis matters because it implies a prescription. In Autor and Dorn’s NYT piece, the only real policy solution they nod to is boosting the share of workers with higher education, noting that “the payoff for college and professional degrees has soared.” And if one believes that technology is boosting demand for high-skill workers and that’s why middle-wage jobs are suffering, this policy solution does make sense. But in fact, the payoff to a college degree has actually been pretty flat for more than a decade now. Wages for those with an advanced degree have done better, but this group is just over 10 percent of the workforce—which is a key reason why Autor and Dorn note that boosting the share of workers with college or advanced degrees can’t be a “comprehensive solution to our labor market problems.”
What We Read Today
Here are a few articles we read recently. What did you read today?
- Should White House interns be paid? (The Week)
- Unfinished Work: Walter Reuther and the March on Washington (Dissent)
- The Socialists Who Made the March on Washington (The American Prospect)
- No More Second Chances for Larry Summers (The Nation)
- Professor Pants-on-Fire (The Nation)
- Five speakers to pay attention to at Jackson Hole (MarketWatch)
Slow Wage-Growth Just One More Sign of How Big a Problem the Profit-Biased Recovery Is
On Wednesday, Larry Mishel and Heidi Shierholz released a paper tracking wage-growth over the past decade. It’s familiar but still sad news—the vast majority of American workers have seen essentially stagnant or worse wage-growth over that time.
One angle on poor wage-growth over the past couple of years deserves some attention: the vastly disproportionate share of income-growth that has flowed to corporate profits (and other forms of capital income) rather to wages and (and other forms of labor income).
The figure below shows the share of total corporate sector income claimed by capital income – data that allows for the clearest measure of how much this capital income growth (profits, essentially) has crowded-out labor income growth (wages, essentially). This is the cleanest cut at this issue because in the corporate sector, all income is classified as either labor or capital income. (In the rest of the economy, categories like proprietors’ incomes that are a mix of capital and labor incomes muddy the waters a bit.)
Cato Study Distorts the Truth on Welfare and Work
The Cato Institute recently released a wildly misleading report by Michael Tanner and Charles Hughes, which essentially claims that what low-wage workers and their families can expect to receive from “welfare” dwarfs the wages they can expect from working. Using state-level figures, their paper implies that single mothers with two children are living pretty well relying just on government assistance, with Cato’s “total welfare benefit package” ranging from $16,984 in Mississippi to $49,175 in Hawaii. They then calculate the pretax wage equivalents in annual and hourly terms and compare them to the median salaries in each state and to the official federal poverty level. Tanner and Hughes find that welfare benefits exceed what a minimum wage job would provide in 35 states, and suggest that welfare pays more than the salary for a first year teacher or the starting wage for a secretary in many states.
So what makes this so misleading?
For one, Tanner and Hughes make the assumption that these families receive simultaneous assistance from all of the following programs: Temporary Assistance for Needy Families (TANF), Supplement Nutrition Assistance Program (SNAP), Medicaid, Housing Assistance Payments, Low Income Home Energy Assistance Program (LIHEAP), Women, Infants, and Children Program (WIC), and The Emergency Food Assistance Program (TEFAP). It is this simultaneous assistance from multiple sources that lets the entire “welfare benefits package” identified by Cato add up to serious money. But it’s absurd to assume that someone would receive every one of these benefits, simultaneously.
Another Week, Another Ill-Considered Attempt To Undercut Regulations
No week seems to go by without an imbalanced attack on regulatory protections by a trade association, a “think-tank,” a member of Congress, or a journalist. These attacks frequently feature a reference to the growth in the Code of Federal Regulations, even though it is a meaningless measure of whether we’re overregulated. In offering another bill to diminish regulation, Sen. Angus King, for example, wrote yesterday that, “According to a recent study by the Progressive Policy Institute, the number of pages of federal regulations has increased by 138 percent since 1975, from 71,224 pages to 163,301 in 2011.”
That might sound like a lot of pages, but if you’re not using methylene chloride, polyvinyl chloride or hexavalent chromium, the hundreds of pages devoted to regulating those chemicals have no effect on you or your business. The same goes for IRS transfer pricing regulations, the Department of Agriculture’s beef slaughtering regulations, or OSHA’s crane safety regulations. No one in a small retail business, the tourism industry, or Maine’s lobster industry cares about or need worry about any of them.
Like most of his colleagues, Sen. King denounces “excessive and unnecessary regulations” without identifying examples. If he has a legitimate example, he should let the secretary of the appropriate agency know about it, or work to repeal it legislatively.
Instead, he and his colleague, Sen. Roy Blunt, propose the creation of a 9 member commission that would identify regulations “in need of streamlining or repeal.” The commission would report their recommendations to Congress in the form of a bill that would be “fast-tracked” (protected from many of the normal motions and procedures) and that could not be amended. This proposal is flawed in a number of ways.
Education Investment (Not Low Taxes) is Key to State Prosperity
A new paper released today by EARN (the Economic Analysis and Research Network) looks at what states can do to create strong state economies that support high wage jobs for their people. Is it low taxes, well educated workers, or something else?
When we look at data from across the country, two clear conclusions emerge:
- There is no correlation between the overall level of taxation in a state and the ability of the economy to support high wage jobs (see figure A in this post);
- There is a very strong correlation between how well educated a state workforce is and the ability of the economy to support high wage jobs (see figure B).
Looking at this graph of overall tax levels and median earnings (a measure of wages that includes both hourly and salaried employees) one might suspect that there are just too many differences between states to see a clear correlation on any one variable.
There is no significant correlation between overall tax levels and high-wage economies: Median hourly wage, and state and local taxes as a share of state personal income, by state, 2010
| State | State and local tax revenue as a share of state personal income | Median Hourly Wage (2012 dollars) |
|---|---|---|
| WY | 0.13590238 | $16.97 |
| AR | 0.10037558 | $14.42 |
| NV | 0.10475355 | $15.76 |
| MS | 0.097939908 | $14.16 |
| LA | 0.09574187 | $15.38 |
| WV | 0.10971793 | $16.17 |
| IN | 0.10564875 | $15.70 |
| KY | 0.097442473 | $15.19 |
| OH | 0.10470439 | $15.97 |
| SD | 0.079988074 | $14.96 |
| ID | 0.087547352 | $15.10 |
| OK | 0.08531404 | $15.51 |
| UT | 0.093340332 | $16.17 |
| AK | 0.1974031 | $18.69 |
| SC | 0.088154942 | $15.65 |
| AL | 0.082354177 | $15.19 |
| TX | 0.089617786 | $15.14 |
| TN | 0.081749962 | $14.53 |
| IA | 0.10341089 | $15.82 |
| AZ | 0.09064911 | $16.31 |
| NC | 0.098868851 | $15.71 |
| MT | 0.094412722 | $14.69 |
| WI | 0.11274396 | $17.19 |
| MI | 0.1053127 | $16.75 |
| NE | 0.10207951 | $15.59 |
| MO | 0.086906169 | $15.95 |
| FL | 0.091142418 | $16.65 |
| ME | 0.12008039 | $16.04 |
| PA | 0.10247088 | $17.23 |
| NM | 0.096224878 | $15.98 |
| HI | 0.11820127 | $16.81 |
| ND | 0.12142884 | $15.75 |
| GA | 0.089791357 | $16.82 |
| US | 0.1031523 | $16.85 |
| DE | 0.10092502 | $18.31 |
| OR | 0.095232536 | $16.61 |
| RI | 0.10883045 | $17.88 |
| CA | 0.11036228 | $17.83 |
| WA | 0.094482239 | $19.30 |
| MN | 0.10786811 | $18.48 |
| KS | 0.10357631 | $15.77 |
| VT | 0.11876957 | $17.09 |
| IL | 0.099506408 | $17.07 |
| NH | 0.086699291 | $18.96 |
| NY | 0.1430054 | $18.39 |
| VA | 0.088036271 | $18.78 |
| CO | 0.096436107 | $18.73 |
| NJ | 0.11515426 | $20.26 |
| MD | 0.099771245 | $19.93 |
| CT | 0.1080529 | $21.03 |
| MA | 0.099847735 | $20.88 |
Source: Authors' analysis of Current Population Survey Outgoing Rotation Group microdata and Tax Policy Center's Tax Facts data
Bankruptcy Judge Should Respect Michigan’s Constitution Even If Michigan Governor Rick Snyder Doesn’t
Gov. Rick Snyder is corrupting Detroit’s recovery even before it begins. By ignoring the state’s constitution and its protection for accrued public employee pensions, Snyder is undermining the rule of law and adopting the kind of “ends justify the means” reasoning that usually precedes violations of public trust. Snyder has violated his oath to uphold and defend the state’s constitution by asking a federal court to reduce the pensions of Detroit’s public employees, including many who risked their lives for years in service of the city.
The Michigan constitution is unambiguous. Section 24 states:
“The accrued financial benefits of each pension plan and retirement system of the state and its political subdivisions shall be a contractual obligation thereof which shall not be diminished or impaired thereby.”
Yet, Gov. Snyder has set in motion a bankruptcy process whose aim is to do exactly what the constitution forbids – to diminish that contractual obligation and pay Detroit’s pensioners and retirees less than the full financial benefits they earned.
One can only hope that U.S. Bankruptcy Court Judge Steven Rhodes will rule, instead, that Emergency Manager Kevyn Orr and Gov. Snyder did not have the authority to file a bankruptcy petition that would unconstitutionally impair the city’s pension obligations.