What to Watch on Jobs Day, Part 2: January Is Benchmark Month
January is the month for “benchmark revisions,” which is when BLS revises its sample-based estimates to match other comprehensive data sources. Preliminary estimates of the benchmark revision, released last fall, showed that with this benchmark revision, the over-the-year change in employment between March 2012 and March 2013 is likely to be revised downward by 124,000. This means that we are likely to find that the gap in the labor market due to the Great Recession and its aftermath is larger than we think it is. Right now, the gap is estimated to be 7.7 million, if the preliminary estimates hold, the gap is instead over 7.8 million.
Another thing happening with this benchmark revision is a code change that moves nearly half a million in employment from the Private Household industry—which is not counted in the establishment survey—to the Education and Health Care Services industry, which is. This means the level of employment in the establishment survey will increase to reflect this coding change. I checked with BLS and they reported they will be revising employment, hours, and wage data back to 1979 to reflect this change.
The household data (which is where the unemployment rate and the labor force participation rate come from) will also be affected by new population controls, but in accordance with standard practice, earlier household data will not be revised to reflect these changes. This means that if you want to know the change in unemployment and labor force participation between December and January, you can’t look at the regular published data, and instead must look at the extra information provided, which will show the over-the-month change after removing the effect of the new controls. Look to tables B and C here to see what information was provided last year at this time.
Court of Appeals Hands Victory to U.S. Workers
The U.S. Court of Appeals for the Third Circuit ruled yesterday that the Department of Labor’s H-2B visa wage methodology regulation is valid, handing a defeat to a coalition of employers who want to keep wages low for employees in forestry, seafood, hospitality, landscaping and other physically demanding jobs. In Louisiana Forestry Association v. Secretary, U.S. Department of Labor, the court held that the Immigration and Nationality Act gives the Department of Homeland Security the authority to rely on the Labor Department’s decisions about whether U.S. workers are available for jobs that employers want to offer to foreign workers, and whether U.S. workers will be adversely affected if foreign workers are admitted to the U.S. to do particular jobs.
The Labor Department issued a regulation in 2011 that sets out the most important element for making that determination: setting a prevailing wage rate for each occupation and requiring businesses to advertise jobs to workers in the United States at that rate before hiring foreign workers. The court held that the regulation is valid and rejected the businesses’ argument that the Department of Labor cannot set wages at a level high enough to attract U.S. workers.
What to Watch on Jobs Day: Yes, We Should Still Be Worried About the Labor Force Participation Rate
The employment data last month showed that just 74,000 payroll jobs were added in December. It is unlikely that the underlying job growth rate is this weak, so the January data, which comes out on Friday, should look substantially better. However, beating 74,000 jobs is a very low bar. To get back to pre-recession labor market conditions in three years, we would need to be adding 285,000 jobs per month. It’s more likely that we’ll see something closer to the average number of jobs added per month in 2013, which was 182,000. At that rate it will take well over five more years to get back to health in the labor market.
Another thing to watch is the labor force participation rate (LFPR), which has dropped from 66.0% to 62.8% over the last six years. My estimates suggest that about one-quarter of that drop is due to long-run factors like baby boomers hitting retirement age and increasing college enrollment of young people, and had nothing to do the Great Recession or the weak recovery. That means about three-quarters of the drop in LFPR is due to potential workers either dropping out of, or never entering, the labor force because job opportunities are so weak.
The labor force may have dropped further in January, due to the expiration of federal unemployment insurance benefits in December. Careful research (here and here) shows that these benefits were keeping people in the labor force. To receive unemployment insurance, workers must be actively seeking work, so receiving UI was giving people a reason to keep looking for work even though job prospects are bleak. (This is actually a good thing because it may increase the share of displaced workers who ultimately find work). A drop in labor force participation due to the expiration of UI extensions would likely lead to another “bad” kind of drop in the unemployment rate—one that comes from potential workers giving up looking for work, not potential workers finding work. This would compound an already serious issue—there are already 6 million “missing workers,” who, because of weak job opportunities, are neither employed nor actively seeking a job. If these missing workers were in the labor market looking for work, the unemployment rate would be 10.2% instead of 6.7%.
Latest CBO Report is a Clarion Call for a Growth Agenda
The Congressional Budget Office’s new 10-year Budget and Economic Outlook, released this morning, is truly the bearer of bad news. Compared with CBO’s previous outlook, released last May, spending over the next decade is projected to fall, revenues are projected to dramatically fall, and economic growth is projected to plummet.
On the spending side, a combination of policy changes and slower projected economic growth has led to a downward revision of $594 billion in projected outlays over the next decade. And on the other side of the ledger, projected federal revenues have decreased by $1.4 trillion, all due to newly anticipated slower GDP growth and lower inflation (not to mention a further $200 billion decrease in revenues due to technical corrections). The result is almost a $1 trillion increase in federal deficits over the next ten years.
As this morning’s CBO numbers make clear, economic growth is the largest driver of federal revenue, and hence, the key to bringing down deficits. In the short-run, spurring more growth through fiscal policy is easy from an economic perspective—allow the budget deficit to rise to finance spending that spurs aggregate demand in our still demand-starved economy, fostering a full recovery from the Great Recession. In the longer run, improving overall productivity and growth is key. As the CBO report states, “if the growth of real GDP and taxable income was 0.1 percentage point higher or lower per year than in CBO’s baseline projections, revenues would be roughly $270 billion higher or lower over the 2015-2024 period.”
So how did we get in such dire straits regarding growth?
No, the CBO Did Not Find That the ACA Kills Jobs
For years, health and labor economists have studied the inefficiencies created by the fact that most Americans under 65 get health insurance through their job. One potentially large inefficiency is “job lock”—people making decisions to take and/or keep a particular job because without it, they wouldn’t have affordable health insurance. The research literature tells us that job lock occurs among workers who would otherwise be entrepreneurs, those who would rather retire, and full-time workers who would rather work part-time, as well as for a host of other reasons.
The value of the employer-sponsored health insurance system is two-fold (and please bear with the oversimplification). First, it pools risk and charges the same price for workers within an organization regardless of their or their dependents’ health status. Second, it’s far better than what’s historically been offered in the individual health insurance market (e.g. denied policies, excluded conditions, discriminatory pricing, etc.). Enter the Affordable Care Act, which has now established state-based health insurance exchanges that significantly reform the individual insurance market and make it possible for many workers and their families to find affordable health insurance coverage outside the employment-based market.
Which brings us to today. The Congressional Budget Office released its Budget and Economic Outlook, and, in Appendix C, one can find an expanded discussion of the labor market effects of the Affordable Care Act.
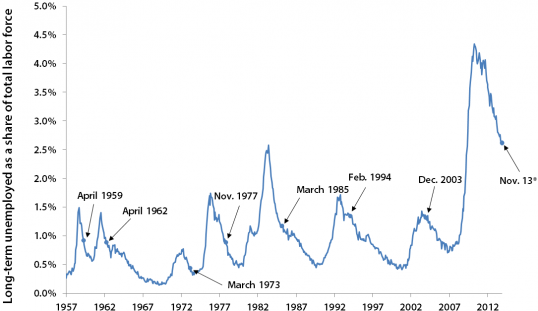
Senators from States with High Long-Term Unemployment Will Decide the Fate of Emergency Unemployment Compensation
The U. S. Senate is about to vote again on providing unemployment compensation for millions of jobless people who are still looking for work after exhausting their regular state unemployment benefits, which usually happens after 26 weeks. The emergency program, which had been in place since the recession hit in 2008, expired at the end of last year. More than 1.6 million people who would have gotten some help have been cut off, left without the income they desperately need to pay their bills and put food on the table. The Senate is expected to vote tomorrow on a brief, three-month extension.
Senators in several states with very high shares of people who have been jobless for more than six months have not signaled which way they will vote: Sen. Kelly Ayotte in New Hampshire (31.6% of the unemployed are long-term), Sen. Rob Portman of Ohio (34.6% of the jobless are long-term), Sen. Ron Kirk of Illinois (41.3% of the unemployed are long-term), and Sen. Dan Coates of Indiana (29.1% of the unemployed are long-term). The unemployment rate in Illinois (8.6%), in Indiana (6.9%), and Ohio (7.2%), is above the national average.
Even though weekly unemployment insurance benefits average less than $300 a week, they make a huge difference to families that might otherwise have no income at all. They can also have a powerful, positive impact on the economy. EPI’s Heidi Shierholz and Lawrence Mishel estimate that continuing the full program of emergency long-term unemployment compensation would have supported more than 300,000 jobs in 2014. The much-reduced program the Senate will debate tomorrow will affect far fewer workers and have a smaller, but still positive impact on jobs and the economy.
The Overall Employment to Population Ratio: Not the Best Summary Indicator, But Not That Misleading, Either
A blog post by researchers at the Federal Reserve Bank of New York has been making the rounds today, arguing that much of the decline in the employment to population ratio (EPOP) since the Great Recession began is actually reflecting changing demographics of the workforce. The researchers (Samuel Kapon and Joseph Tracy) argue that the overall U.S. EPOP in recent years should have been expected to fall relatively rapidly simply because so many U.S. workers were reaching typical retirement ages and were voluntarily leaving paid work. Given this, they claim that the overall EPOP is a misleading labor market indicator if it’s large fall and subsequent non-recovery is taken as evidence that a demand shortfall continues to keep aggregate demand further beneath the economy’s productive potential than other labor market measures—like the overall unemployment—are currently indicating.
I don’t think this is right.
First, as Matthew Klein has noted on Twitter, the same reasoning doesn’t apply if we just look at the EPOP for prime-age working adults—those between 25 and 54. It seems hard to imagine why lots of these workers would be voluntarily retiring starting right at the beginning of the Great Recession. And yet this measure shows the same sharp decline and subsequent very slow recovery as the overall measure.
Second, a key piece of the method used by Kapon and Tracy to estimate the “trend” EPOP actually answers the question that should be answered by the data. This is how they describe one aspect of their method for constructing the trend:
“… we adopt the normalization that over the thirty-one years in our data sample any business-cycle deviations between the actual and the adjusted E/P ratios will average to zero.”
There Are Plenty of Ways to Cut the Budget. Food Stamps Shouldn’t Be One That Congress Can Agree On.
After two years of debate and foot-dragging, the House and Senate have finally agreed on a farm bill—one that comes with a ten-year price tag of $956 billion. Despite being widely referred to as “the farm bill,” most (almost 80 percent) of the spending in the Agriculture Act of 2014 (its official name) is actually for nutrition programs. And most of that 80 percent goes to fund the Supplemental Nutrition Assistance Program (SNAP, also known as food stamps).
This isn’t to say the other $200 billion in the farm bill—the sections that more closely relate to actual farms—is not worth commenting on. It is. Among other controversies, a vastly disproportionate share of crop insurance subsidies —which were significantly increased in the bill—accrues to the largest (and richest) farm operators.
The big controversy within the bill, however, is the $8.5 billion cut from SNAP over the next decade. The cuts come from a tightening of the eligibility and benefit rules. Many of these are small-bore: prohibiting deducting the costs of medical marijuana when determining a household’s discretionary income and thus its level of SNAP benefit, disallowing households with large lottery or gaming winnings from receiving SNAP benefits, ensuring violent ex-felons receive benefits only if they follow the terms of their parole, and so on. (CBPP has an excellent rundown of such provisions.)
Raising the Maryland Minimum Wage Will Benefit Nearly Half a Million Workers and Modestly Boost the State’s Economy
Since the end of the Great Recession, Maryland’s economy has slowly healed. The state has gained back all of the jobs lost in the downturn, and Maryland’s unemployment rate of 6.1 percent is down significantly from its high of 8.0 percent in early 2010. Yet despite this improvement, there are still considerable challenges facing Maryland workers and families. Population growth since December 2007 means that the state needs to create more than 180,000 jobs just to get back to the unemployment rate preceding the recession.1 Furthermore, wages have fallen significantly for the majority of Maryland workers, particularly for low-wage workers—real wages at the 20th percentile declined by a nation-leading $1.24 since 2009. Raising Maryland’s minimum wage would combat these downward wage trends and put much-needed money in the pockets of low-income workers who are likely to spend that additional income right away. Given current economic conditions, where tepid consumer demand is holding back employment growth, this additional consumer spending would provide a modest, but meaningful boost to Maryland’s economy.
The Maryland Minimum Wage Act of 2014 (SB 331 and HB 295), similar to a proposal we analyzed last year, would raise Maryland’s minimum wage from the current $7.25 per hour to $10.10 per hour by 2016. It would also increase the tipped minimum wage from 50 percent to 70 percent of the full minimum wage, and index both wage rates to rise automatically with the cost of living. The data show that this proposal would improve the well-being of thousands of working families in Maryland, while injecting almost half a billion dollars into the economy.
![]() Download the PDF version of this analysis
Download the PDF version of this analysis
This analysis provides an overview of the economic impact and demographic details of the workers who would benefit from the proposed increase in the minimum wage, examining their gender, age, race and ethnicity, educational attainment, work hours, family composition, and other characteristics. It also details the estimated economic activity and job-creation impacts that would result from raising the Maryland minimum wage to $10.10.
Who Wins From Trade?
In his State of the Union Address, President Obama said that because “ninety-eight percent of our exporters are small businesses, new trade partnerships with Europe and the Asia-Pacific will help them create more jobs.” This suggests that small businesses will benefit most from trade, but that is not the case. In fact, two-thirds of U.S. exports are generated by multinational companies (domestic and foreign) operating in this country, as shown in the figure below. These massive firms also generated more than two thirds of U.S. imports and an even larger share of the job-destroying U.S. goods trade deficits.
And therein lies the not so hidden underbelly of international trade and investment deals that the president has consistently refused to discuss: job displacing imports. A surge of imports from low wage countries has driven down wages for working people in the United States. In fact, imports are responsible for 90% of the growth in the college/noncollege wage gap since 1995.
Those same multinational companies were the biggest supporters of trade and investment deals with Mexico, Korea and China, deals that have cost U.S. workers nearly four million jobs in the past two decades. Now, the multinationals are demanding that the president complete trade deals with nearly a dozen countries in Asia and Latin America (the TPP), and a new trade and investment deal with Europe (the TTIP) that will open our markets to goods made by millions of low wage workers in Eastern Europe.
Assessing the New Republican “Standards for Immigration Reform”
Speaker of the House John Boehner has just released the Republican Party’s anxiously awaited and very brief “Standards for Immigration Reform.” President Obama and the Democrats, and the Senate generally, have needed a dancing partner to get immigration reform passed, move the country forward, and give it an economic boost by granting legal status and citizenship to the nearly 12 million unauthorized immigrants who are living in the shadows. Although it’s far from a concrete legislative proposal, the Standards released today at least give us a hint of what the Republican caucus might eventually be willing to vote on.
My initial reaction to the Standards can be summed up as, “You’ve come a long way, baby.”
Boehner laid out six specific Standards. Much of it is unobjectionable and looks very similar to what passed in the Senate’s comprehensive immigration bill (S. 744) in the summer. The section titled “Border Security and Interior Enforcement Must Come First” is vague and takes a jab at administrations from both parties for not adequately enforcing immigration laws, and takes a thinly veiled swipe at President Obama by noting that presidents should not be able to “unilaterally stop immigration enforcement.” This of course, ignores the nearly two million deportations the president’s Department of Homeland Security (DHS) has carried out, much to the chagrin of his progressive supporters and immigration advocates. The “Employment Verification and Workplace Enforcement” and “Implement Entry-Exit Visa Tracking System” sections are also vague, but broadly call for E-Verify and entry-exit visa system reforms like those in S. 744. One notable exception is the Republicans’ insistence that the entry-exit system be biometric. (Whether such a system should be biometric was a main topic of contention during the Senate’s debate on S. 744.)Read more
Equal Pay for Women and a Higher Minimum Wage Will Move the Economy Forward
Yesterday morning, I had the honor of participating in a Democratic Steering and Policy Committee hearing, hosted by Leader Nancy Pelosi, in the Cannon House Office Building. Appearing with Lilly Ledbetter—whose story of pay discrimination went all the way to the Supreme Court and ultimately resulted in new legislation in 2009 named after her—and Laura Miu, a psychological counselor, who recently experienced pay discrimination, I was able to share recent research by the Institute for Women’s Policy Research (IWPR), which I lead, and by the Economic Policy Institute (EPI), the think tank that provides the last word on virtually all topics related to American workers. The briefing attracted 20 members of Congress, including Representatives Rosa DeLauro and Robert Andrews, who co-chair the Steering and Policy Committee, and Representatives Donna Edwards and Doris Matsui, who chair and vice-chair, respectively, the Democratic Women’s Working Group. IWPR’s research was originally released in January when it appeared in the latest Shriver Report, A Woman’s Nation Pushes Back from the Brink, produced in partnership with the Center for American Progress. EPI’s research was published as an update in December 2013 of an earlier paper last spring that details the impact of an increase in the minimum wage to $10.10 per hour.
The economic progress women have made in the past five decades is enormous. Women have entered many occupations that had been virtually closed to them, now earn more over their lifetimes, and contribute more to family income and to the economy as a whole than ever before.
But there is still a long way to go. Despite the passage of the Lilly Ledbetter Fair Pay Act of 2009, which makes it easier for women to sue for equal pay—avoiding a similar plight as the bill’s namesake, when she learned she was earning vastly unequal pay near the end of her career—progress toward closing the pay gap has stagnated. Since 2000, the wage ratio has remained around 76.5 percent. If trends of the past five decades are projected forward, it will take almost another five decades—until 2058—for women to reach pay equity.
Scratching Just One Level Below Surface, Growth Numbers Look a lot Less Impressive
The last six months of 2013 saw the headline GDP growth rate reach 3.7 percent. That’s a healthy number. Not gangbusters (we really have seen growth rates over 5 percent for a year or more in previous recoveries where there was slack in the economy comparable to what persists today), but undeniably healthy.
So what’s to be glum about?
Strip out the contribution of inventory investments and exports, and add in (rather than subtract) the value of imports. This is a measure of real “final sales to domestic purchasers,” or, what is sometimes called domestic demand. It’s a measure of how much demand from households, businesses, and governments is growing—and since the economy’s problem remains a huge shortfall of this demand relative to productive potential, it’s a key barometer of health.
Domestic demand growth for the last six months of 2013 was only half as fast as headline GDP growth (1.8 percent).
Key evidence that this slow rate of domestic demand growth is keeping us from making good progress in closing the gap between aggregate demand and potential supply (and closing this gap really should be the operative definition of “full recovery”) is the stubbornness of core price growth—the year over year change in the “market-based” deflator for core (i.e., excluding food and energy) price deflator for personal consumption expenditures was 1.1 percent for the last three quarters of 2013. This is well below the too-conservative target of 2 percent inflation often assumed to be guiding monetary policymakers. In short, this is a clear sign of an economy not climbing rapidly back to full employment.
Are there any reasons to be less glum about 2014? For sure.
The big one is that federal fiscal policy will no longer be actively throttling growth. It knocked nearly a full percentage point off the fourth quarter growth rate. To be clear, fiscal policy won’t aid growth in 2014, instead it will provide a very slight drag rather than an anvil-heavy drag. This is what counts as progress in today’s fiscal policymaking. But, we’ll take what we can, I guess.
Holding Out For a Better Retirement Plan
Details of the president’s new retirement plan emerged today, and it’s nothing to get excited about. On the bright side, it’s refreshing to see a focus on investment risk, since many 401(k) participants invest too aggressively based on the mistaken belief that cumulative returns average out over time, while risk-averse people may be put off from saving altogether.
However, cautious savers already have convenient access to low- or no-risk investment options, either through existing retirement accounts or by purchasing Treasuries through automatic payroll deduction. What the myRA plan does is offer a modest tax break for investing in a Treasury bond fund similar to one available to federal workers. The tax benefit is modest because it is based on taxes that would otherwise be paid on investment earnings, which would likely be low.
MyRA accounts would be structured like Roth IRAs, with taxes paid up front. Another selling point of the president’s plan is that participants would be able to change their minds and withdraw their money without paying a penalty, encouraging participation by risk-averse low-income workers. However, this would also likely lead to significant pre-retirement leakage. Finally, participants would earn slightly higher investment returns than they would by investing in short-term Treasury bills without being locked in to a longer-term investment.
Green Cards for Detroit? Interesting Idea, but Mostly a Distraction
Rick Snyder, the Republican Governor of Michigan recently introduced a new plan to “jump-start” the economically suffering city of Detroit. He proposes that over the next five years, the government authorize the granting of 50,000 EB-2 green cards—i.e., immigrant visas granting legal permanent resident (LPR) status in the employment-based, second preference category—to foreign workers who hold advanced degrees or have “exceptional ability” and are willing to live and work in Detroit. This could either be done by creating additional new immigrant visas, or by reallocating existing ones. There’s no question that Detroit needs many more people to move into its empty spaces and increase its tax base dramatically. But is this the way to do it? It’s an interesting idea worth exploring, but the mechanics of it would be complicated, the numbers are probably unrealistic, and the politics will undoubtedly be messy. It also takes the focus off the 18 percent of workers in Detroit who are unemployed, and those who are seeing their pensions plundered. With that being said, here are some of the main issues at play.
Allocating new or existing immigrant visas to an individual city or state has never been done in the United States. However, it is not unprecedented. Many Canadian provinces are able to sponsor permanent residence visas for immigrants who agree to live and work in the sponsoring province (what’s known as the Provincial Nominee Program). If enacted in the United States, an important question to consider would be the visa’s terms and conditions: Immigrants granted an EB-2 can live and work anywhere they wish, so to restrict them to Detroit, the government would have to make the visa provisional; that is, make it revocable if the holder doesn’t live and work in Detroit.
The President Drills Down to the Core Challenge: Creating Good Jobs and Raising Wages
In his State of the Union address last night, President Obama articulated some core truths that ought to guide economic policy, with lines like “the best measure of opportunity is access to a good job,” and “Say yes. Give America a raise.”
We need policies to create more jobs, but we must insure that they’re good jobs, with benefits and decent pay that can support a family and fuel economic growth based on what people earn on the job, as opposed to what households borrow or “gain” in asset bubbles.
The president highlighted the problem of stagnant wages, noting that “women hold a majority of lower-wage jobs—but they’re not the only ones stifled by stagnant wages.” This is absolutely true. I illustrated this point recently by pointing out that the share of young (ages 25-34) men earning poverty-level wages ($11.29 in 2012) had doubled from 1979 to 2012, jumping from 10.8 to 25.5 percent. Young women were even more likely to earn poverty-level wages, with 31.1 percent doing so in 2012. There’s been some, but not much, progress for women on this front, since a third earned poverty-level wages in 1979.
This is not news to us at EPI—we’ve focused on job quality and wage stagnation since our founding in 1986, and pounded on these themes in the twelve editions of the State of Working America and numerous other works. Generating better jobs and better pay is the key to addressing inequality and strengthening and expanding the middle class. Unfortunately, we have only seen broad-based wage growth for a few years (the late 1990s) over the last four decades. Over the last ten years there has been no wage growth for the vast majority of workers, white collar or blue collar, among college and high school graduates. We cannot get where we want to go unless different wage dynamics are generated and that has to be a central focus of economic policy. The president’s call for Congress to pass the Harkin-Miller minimum wage bill was absolutely right, as is his executive order requiring federal contractors to pay $10.10. Providing income to working families through a robust social insurance system, and work supports such as an improved EITC, are also pillars of economic growth and living standards.
Five Years of Lilly Ledbetter and Still More Work Needs To Be Done
Today marks the fifth anniversary of the Lilly Ledbetter Fair Pay Act. Named after Lilly Ledbetter, who worked for a production plant for years without knowing she was getting paid less than her male counterparts, the bill protects workers against pay discrimination. The Supreme Court had previously ruled that Ms. Ledbetter had filed her case too late, as the company’s decision on her case had been made years earlier. The law now says that pay discrimination on the basis of sex, race, origin, age, religion and disability occurs whenever an employee receives a discriminatory paycheck, when a discriminatory pay decision is adopted, or when a person is affected by a pay decision or practice. It is a great first step in giving women the tools to be economically secure in today’s workplace. But it’s not enough.
At a time when both women and men face the lingering effects of the Great Recession and stagnating wages at all education levels, a crucial step to improve women’s labor market success is to ensure a full recovery from the Great Recession. While it is true that women have regained pre-recession employment levels—contrasted with men, who are still 1.5 million short—women’s comparable return to 2007 employment is largely because the industries that have taken the biggest employment hits since 2007 also have a disproportionately larger share of male workers. However, within the majority of industries, women’s job growth has trailed men’s. Additionally, these numbers fail to address the fact that the working-age population (and with it the potential labor force) is growing all the time. Accounting for the growth in the potential female labor force, women are still 3.5 million jobs in the hole.
In this economy, it is clear that women need more jobs (as do men), but they also need pay equality. Women who work full time, year round still only earn 77 percent of what men earn, a pay gap that accumulates over time. For a 40-year working career, the average woman loses $431,000—no small amount. And, women with a college degree are no exception. Over their lifetime, women with at least a bachelor’s degree earn approximately $713,000 less than similarly educated men over their lifetime. Additionally, over half of women workers make poverty-level wages over half of the poverty-level wage workers are women (poverty-level wage workers are defined as workers who earn wage below what a full-time, full-year worker needs to give a family of four enough income to reach the poverty threshold). Fully, 32.0 percent of workers in 2011 earn poverty-level wages.
Good Eric Schmidt vs. Evil Eric Schmidt
Things are good for Google Executive Chairman Eric Schmidt. With $8.3 billion in his bank account, he’s the 49th wealthiest person in America. And he spent the week at the Davos World Economic Forum to celebrate.
During Schmidt’s Davos fireside chat, which was reported on by Henry Blodget at Business Insider, Schmidt had this to say, in the context of a discussion of income inequality:
“The stagnation in middle-class wages is not just a middle-class problem. It’s an economic problem. And it’s one of the main reasons that global economic growth is so lousy.
Why do stagnant middle-class wages hurt the economy?
Because the middle-class folks whose wages are stagnant are the global economy’s biggest spenders.”
He hit the nail right on the head. Wages for the vast majority of Americans have been basically flat for the last 40 years. To be specific, wages for the median worker have increased by just 5.0 percent between 1979 and 2012. During that time, workers gained a lot of education, and the economy as a whole became 75.4 percent more productive—we now produce more per hour worked than we ever have. Yet the typical American worker is being paid almost no more than his or her counterpart a half century ago.
The Tight Link Between the Minimum Wage and Wage Inequality
A higher minimum wage is an important way to address wage inequality, as the erosion of the minimum wage is the main reason for the increase in inequality between low-and middle-wage workers (in particular the 50/10 wage gap, that between the median and the 10th percentile earner). This is particularly true among women, the group for whom the wage gap in the bottom half grew the most. As the figure below shows, two-thirds of the increase in the 50-10 wage gap can be attributed to the erosion of the real value of the minimum wage. [The 50/10 wage gap grew 25.2 (log) percentage points between 1979 and 2009 and that two-thirds of this increase (16.5 percentage points, or 65 percent of the total) can be attributed to the erosion of the minimum wage.] The paper this figure draws on usefully and appropriately captures the spillover impact of the minimum wage—the impact on those earning above the legislated rate. This finding makes sense, since it was in the 1980s that the minimum wage eroded the most, and that was the same time period when the 50/10 wage gap among women expanded greatly. The erosion of the minimum wage explains over a tenth (11.3 percent) of the smaller 5.3 (log) percentage point expansion of the 50/10 wage gap among men. For workers overall more than half (57 percent) of the increase in the 50/10 wage gap was accounted for by the erosion of the minimum wage.

Life Is Worse In Right-To-Work States
University of Oregon labor scholar and EPI research associate Gordon Lafer often points out how relatively poor the quality of life is in right-to-work states, on average, compared to states that don’t restrict union contract rights.
Politico just came out with a new ranking of the 50 states, on a combination of 14 different measures of quality of life, including “high school graduation rates, per capita income, life expectancy and crime rate.” Then they average those 14 to create one overall ranking of the states.
The outcome suggests the opposite of corporate assertions that “right-to-work” states are doing better than others. According to Politico, 4 of the 5 best states to live in are non-right-to-work. In order, they are New Hampshire, Minnesota, Vermont, Utah, and Massachusetts.
Right-to-work states account for 8 of the 10 worst states, and all 5 of the 5 worst states (in order, from 46th-50th: Alabama, Tennessee, Arkansas, Louisiana, Mississsippi). The majority of RTW states are not only in the bottom half of the country, but in the bottom 20 of the 50 states.
Lafer’s home state, Oregon, where corporate backers are trying to pass a public sector right-to-work law, is ranked 23rd, outperforming nearly 2/3 of the states that currently have RTW laws.
The Federal Government Shouldn’t Directly Contribute To America’s Job-Quality Problem
As President Obama searches for ways to improve the wages of American workers by giving them a boost in bargaining for better job quality with their employers, he is limited by the dysfunctionality of Congress, which because of Republican opposition is unlikely to help even with a minimum wage increase. But the president, who manages the vast amount of work the government does through private contractors, should consider what he can do to set reasonable standards for the pay and compensation of the millions of employees of those federal contractors.
As EPI has estimated again and again, far too many people working for private firms— but for the benefit of the federal government, with their wages ultimately paid by the taxpayers—are likely working for poverty wages. This is unacceptable; it is damaging to those workers and their families, and it hurts the economy by reducing demand for goods and services—currently a problem of crisis proportions.
In November 2000, an EPI briefing paper by Chauna Brocht, The Forgotten Workforce, estimated that 162,000 federal contract workers earned less than the then-poverty level wage of $8.20 an hour (by poverty-level wage, we mean a wage for a full-time, full-year worker that would not lift a family of four out of official poverty). Most of the low-wage employers were large businesses and most were defense contractors.
What to Look for in the State of the Union
President Obama will deliver his State of the Union this coming Tuesday, the 28th. It seems obvious that no big new policy initiative that requires action from Congress will pass in the next year, given DC gridlock. This is a real shame, because the crisis of joblessness and failure to fully recover from the Great Recession remains the single largest economic challenge facing the country, and solving it would require a serious course correction on policy. The most reliable fix for this crisis of joblessness would be simply allowing public spending to rise to levels that characterized every other recovery since World War II. Even better would be to allow this spending to rise to levels characterizing the recovery from the similarly steep early 1980s recession. In short, what is needed is not some historically unprecedented stimulus program, but simply an end to the historically unprecedented austerity program now underway.
And it’s pretty easy to specify where the first $25 billion or so of this spending should be allocated: extending the Emergency Unemployment Compensation (EUC) program for long-term unemployed workers—a program begun in June 2008 when the unemployment rate was significantly lower than today and when long-term unemployment was literally half as high. I’d be shocked if the president did not issue a forceful call to pass EUC for the upcoming year.
After this, a substantial program of public investment would be most welcome, boosting job-growth and economic activity in the short-run and boosting productivity in the longer-run. The talking point mobilized in favor of infrastructure investment—that it once was a bi-partisan priority—has the rare virtue of being true even today, so long as one listens to policy analysts and not politicians. For example, Martin Feldstein, Chair of the Council of Economic Advisors under Ronald Reagan, has endorsed a deficit-financed increase in infrastructure investment (granted, he endorses plenty of other things in that column that I’m not on board with, but the point remains). And Ken Rogoff, an economic adviser to John McCain in 2008, has also noted that infrastructure investment would be hugely beneficial in the current economic climate.1
Are House Republicans Sore Winners?
Treasury Secretary Jack Lew sent a letter to Congress yesterday warning that the federal government probably will breach the statutory debt limit in late February. To remind those who may have forgotten, there is no credible evidence that the U.S. economy is running up against any genuine economic constraint on debt. Interest rates remain historically low and federal budget deficits are actually closing historically rapidly. Yet because the United States (almost alone among advanced countries) has an arbitrary limit on the amount of outstanding federal debt that must be periodically renewed through legislative action, approaching the statutory debt limit provides members of Congress the chance to flirt with severe economic damage simply by refusing to raise the limit.
The House GOP leadership claimed that they did not want to get “even close” to a default. However, a spokesperson for House Speaker Boehner said a clean bill to raise the debt limit would not pass the House without some concessions to Republicans in order for them to “save face.” These concessions presumably would be more spending cuts. Given what should be considered a GOP “win” in the recent Murray-Ryan budget deal, one wonders what more do they want? It is worth taking a closer look at the GOP win in the budget deal and compare it to what might have been.
The chart below displays nondefense discretionary budget authority from fiscal year 2006 to fiscal year 2021 (when funds are appropriated by Congress, agencies are given budget authority to incur financial obligations—i.e., spend money). Nondefense discretionary spending includes spending for public investments such as roads, bridges, sewage systems, basic scientific research, and education—all the things that boost long-term economic growth. The Budget Control Act (BCA), the law that gave us the sequester, along with other steep cuts that have attracted less attention, specifies the limits on discretionary spending until 2021. It is specified in nominal dollar amounts, which rise over time. In inflation-adjusted terms, however, the spending is constant. But a better way to measure public spending is as a percentage of GDP—basically looking at public spending in relation to income available to pay for that spending.
The Robots Are Here and More Are Coming: Do Not Blame Them for our Wage or Job Problems
The “robots are coming” narrative dominating discussions of the economy was popularized by Erik Brynjolfsson and Andrew McAfee in their 2011 book, Race Against the Machine. They have built on that theme in the richer, deeper The Second Machine Age (W.W. Norton, 2014). The first half of the book provides a valuable window, at least for a non-technologist like me, into past developments and the future trajectory of digitization. Their claim is that digitization will do for mental power what the steam engine did for muscle power—that is, quite a bit, transforming our lives at work and play.
The remainder of the book dwells on the role of digitization in generating both bounty (more consumer choice and greater output, wealth, and income) and spread (greater inequalities of wages, income, and wealth). In treating these topics, they heavily rely on the work of others. As in their last book, they do not provide much direct evidence of the connection between technological change and wage inequality. I study these issues and believe they are wrong to tightly link digitization and robots to wage inequality and the slow job growth of the 2000s. Although the authors claim “technology is certainly not the only force causing this rise in spreads, but it is one of the main ones” my fear is that this book, like their last one, will fuel the mistaken narrative that technology is responsible for our job and wage problems and that we are powerless to obtain more equitable growth.
Let me start where we agree and where I very much appreciate their argumentation. Brynjolfsson and McAfee are very clear that we are experiencing a dramatic growth in wage, income, and wealth inequality; that living standards have faltered for a significant share of the population; and that these are challenges that must be addressed. They rightly fear that current inequities will generate greater future inequity: They argue that current wealth solidifies and expands inequality through the political process and worry that inequality impedes social mobility—the degree to which a child’s chances are linked to his or her parents’ current station. Inequality begets greater inequality. I appreciate their refutation of denialism and ‘so whatism’.
Their weakest case is that digitization is associated with the slow job growth of the last 15 years. The authors review all the reasons why economists find such a claim untrue, including 200 years of history disproving a link between technology and slow job growth. They propose a few reasons why things may be different now. However, their only evidence is that employment and productivity grew in tandem for many decades but became decoupled in the late 1990s and offer their “reading of technology” as an explanation. In fact, there’s a simple answer to the riddle of slow job growth: slow economic growth resulting from the collapse of two asset bubbles and inadequate policy responses. Job growth occurs when economic growth exceeds productivity. Simply put, if workers can produce 2 percent more this year than last year, the economy can grow 2 percent without adding any employment. Thus, the economy must grow faster than productivity to create jobs, something that has not happened in the unique circumstances of the 2000s.
Recommitting to Dr. King’s Goals Would Help All Working Families
Monday’s celebration of Dr. Martin Luther King Jr.’s legacy presents the perfect opportunity to reflect on how far the country has come and to acknowledge the undeniable advancements African Americans have made, and to consider the goals that remain unmet. Last year, EPI released the Unfinished March, a series of reports that detailed the remaining steps to fully achieve the goals of the March on Washington for Jobs and Freedom, the setting for King’s “I Have a Dream” speech. Yet to be achieved are the hard economic goals, critical to transforming the life opportunities of African Americans. They include decent housing, adequate and integrated education, full employment, and a national minimum wage that can realistically lift a family out of poverty.
The employment trends for African Americans over the past decade, as seen in this week’s Economic Snapshot, show just how much work remains to be done just to achieve the goal of full employment. While the economic woes of the past few years have worsened labor market prospects for all workers, for African American workers the employment situation is significantly worse, akin to depression-level conditions. An estimated 19.6 percent of black workers (nearly one in five) were unemployed at some point in 2013. Furthermore, given unemployment projections for 2014, it is likely that 17.4 percent of black workers will be unemployed at some point this year.
Needless to say, it doesn’t have to be this way. Recommitting ourselves to achieving Dr. King’s goals means implementing policies that would aid all U.S. workers, including large-scale ongoing public investments, the restoration of public services and public-sector employment cut in the recession and its aftermath, and the renewal of federal unemployment insurance benefits. Passing these policies would not only celebrate Dr. King’s legacy, but also help working families, of all races, across the country.
New Analysis of the Labor Market Outcomes of Employment- and Family-Based Immigrants Can Improve Policymaking
Unlike other developed countries such as Australia and Canada, the U.S. government simply does not collect and analyze enough information on the labor market outcomes of immigrants who are issued visas that grant them legal permanent resident (LPR) status. Especially when it comes to longitudinal data that track the same immigrants over time in order to see how their situation has changed. This dooms policymakers to make uninformed decisions based on assumptions or that are influenced by lobbying from interest groups. That’s why new (and as-of-yet unpublished) research from Professors Mark Rosenzweig (Yale University) and Guillermina Jasso (New York University) is groundbreaking: it analyzes data from Princeton University’s New Immigrant Survey (NIS) and offers a glimpse at how immigrants in the United States are performing in the labor market over time and by visa category.
The NIS “is a nationally representative multi-cohort longitudinal study of new legal immigrants and their children to the United States,” and one of the most useful data sets available on U.S. immigrants. The first cohort of immigrants participating in the NIS were interviewed in 2003, and follow-up interviews were conducted from 2007 to 2009. Rosenzweig recently presented their research based on these survey data at an informative conference on family immigration hosted by the U.S. Department of Homeland Security and the Organisation for Economic Cooperation and Development (OECD). He showcased some of the first analyses of the NIS’s longitudinal data on the labor market performance of immigrants who came to the United States through the Diversity Visa (DV) lottery and the employment-based (including spouses) and family-based immigrant visa categories; the latter of which represent two-thirds of all immigrant visas issued (by far the highest share in the OECD), and allow foreign citizens to join a spouse or parent who is a U.S. citizen or LPR, or to join the son, daughter, or sibling of a citizen already in the United States. (Lindsay Lowell of Georgetown also presented notable new research and findings documenting the growth of the family-based visa category in the United States since the 1970s.)
Seth Harris’s Legacy: Lives Saved, Wages Restored, Pensions Secured, and a More Effective U.S. Department of Labor
The Deputy Secretary of Labor for the last five years is not well known outside his agency (deputy secretaries are never well known, they’re supposed to avoid the limelight), but his record—the Department’s record of achievement during his tenure—deserves to be known and praised by every American who cares about justice and an economy that delivers shared prosperity. Seth D. Harris was appointed by President Obama in 2009, but he had already spent eight years at the Department as an aide and counselor to Secretary Robert Reich and as an Assistant Secretary under Secretary Alexis Herman. As Secretary of Labor Tom Perez said yesterday, no official since Frances Perkins in the 1930s has understood every aspect of the agency’s mission as thoroughly as Seth Harris, and the agency was much smaller then! It’s unlikely that anyone so knowledgeable will ever serve at the Department of Labor (DOL) again.
When Harris and Secretary Hilda Solis took office in 2009, the Department of Labor was a demoralized agency with poor operating systems and a disappointing record of declining enforcement and regulations that undermined the agency’s mission in important ways. With Secretary Solis’s support, Deputy Secretary Harris, as chief operating officer of the department, completely turned things around.
Partnership or Putsch?
This article originally appeared on Project Syndicate.
In 2010, I sat across the table from Assistant US Trade Representative Barbara Weisel, who was responsible for negotiating the Trans-Pacific Partnership (TPP), the mega-regional free-trade treaty among Vietnam, Malaysia, and ten other Pacific Rim countries that President Barack Obama’s administration wants to conclude in the coming weeks. At the time, I was Senior Policy Adviser for the US House of Representatives’ Committee on Education and Labor – a position that made me the top congressional staff member responsible for upholding labor standards in international trade treaties.
The purpose of the meeting was for Congress to understand what steps the Obama administration was taking to protect American workers from being forced into unfair competition with workers from low-wage trading partners. I asked Weisel what I thought was a simple question: “What is the White House’s position on democracy?” Weisel claimed not to understand, so I explained: A majority of congressional Democrats supported the principle that the United States should sign trade agreements only with countries that are democracies.
Other democracies feel the same way. For example, trade agreements negotiated by members of the Commonwealth of Nations (formerly the British Commonwealth) contain just such a provision. The logic is obvious: If we in developed democracies had lacked the right to protest, speak out, organize unions, and vote for representatives of our choosing, we would never have ended child labor or established the eight-hour workday. Having used these rights to raise our own living standards, we should not now put developed countries’ workers in direct competition with workers who lack the basic freedoms needed to improve their own conditions.
No Matter How We Measure Poverty, the Poverty Rate Would Be Much Lower If Economic Growth Were More Broadly Shared
In an op-ed for the New York Times, Jared Bernstein discusses the relationship between GDP and poverty. He explains that growing inequality, not slowing GDP, led to a higher poverty rate than we would have had if economic growth were broadly shared. We create the same graphic in The State of Working America. Not surprising as Jared is a co-author on previous versions. I’m replicating the same idea below using the historical relationship between GDP and poverty from 1959 to 1979 to predict poverty to 2012. As you can see, poverty hits zero by the early 1990s. We choose a different end date in creating the prediction, which changes the estimated date poverty falls to zero, but the same basic fact remains: Poverty falls fast and would be erased from the United States had economic growth been as broadly shared as it had been in the years leading up to the late 1970s.
Many commentators, researchers, and others have argued that the official poverty measure fails to fully take into account the government tax and transfer system, which has accomplished much to reduce absolute deprivation. Some transfer programs are accounted for in the official poverty measure,including Social Security and unemployment insurance. Others, such as food stamps, housing assistance, and the earned income tax credit are not included in the official poverty measure. The Supplemental Poverty Measure (SPM), created by the Census Bureau, effectively takes many of these into account while simultaneously altering the threshold at which poverty is measured against.

Class War: The View From the Board Room
This post originally appeared on The American Prospect.
The Vice-President for Governmental Affairs has just finished his report to the corporate board of directors. “Thanks, Ted,” says the Chairman. “You and your Washington staff have done a great job. Getting that little amendment inserted in the budget bill will save us at least $25 million next year. …. Questions or comments? Paul?”
Paul, the hedge fund CEO: “I’m worried about the big picture down there in Washington, Ted. It’s a mess. Deficit out of control.The anti-business attitude. Not to mention incompetence. Can’t even run a website for their own health care program. Pathetic.”
“Amen,” says Hank, who used to run a tobacco company. “What bugs me is Obama’s complaining about inequality. Just whips people up. Saw them last night on the TV news, in front of a McDonald’s somewhere, screaming for more money. Makes you sick. Want money? Get a job!”
“Actually Hank, those people already have a job,” says Cliff from Silicon Valley. “And lucky to have it. Plenty more out there ready to take their place.”