Does America’s monopoly problem mean that high-pressure labor markets can’t boost wages?
Last week, I wrote a piece on why the erosion of workers’ labor market leverage does not imply that genuine full employment won’t be accompanied by wage growth. It was in response to questions about why wages in the United States weren’t growing faster given that unemployment is pretty low in historical terms. The punchline of the discussion was pretty clear: the definition of full employment is wages rising fast enough to put upward pressure on the Federal Reserve’s inflation target. If wages aren’t rising this fast, then we aren’t at full employment. The eroding relative labor market leverage power of workers does not change this.
Another reason often given for slow wage growth in the face of relatively low unemployment is rising monopolization. Does monopoly change any of the calculus I sketched out above? Almost surely not.
To be really clear on this, I’m more-than-sympathetic to the view that the U.S. economy has a monopoly problem. Empirical research clearly shows upticks in industry concentration ratios, and a number of large and crucial economic sectors (health care and finance, in particular) are characterized by immense pricing power of producers. Other sectors (mostly technology) have also seen waves of consolidation that have not led (yet?) to rapid price growth, but have raised a whole host of concerns about the intersection of economic and political power.
A long spell of very low unemployment would raise wages—even in the face of employers’ monopsony power
Probably the most-asked question about the U.S. economy in recent months has been “why aren’t wages growing faster?” For years during the slow recovery from the Great Recession of 2008–09, the reason why wages weren’t growing fast enough was pretty clear: the labor market had too much “slack”, represented by the millions of potential workers sidelined by the crisis who were queuing up to take any available job. The big bargaining chip workers have when negotiating for higher wages is the threat to quit and find another job. This threat isn’t very credible when alternative work is hard to find and there are multiple workers who would jump at the chance to take your current job.
But because unemployment has dropped below pre-Great Recession levels, many have decided that labor slack can’t be the cause of subdued wage growth anymore. So, the search for causes of sluggish wage growth that are not labor slack has begun. Two (potentially related) suspects accused in recent months have been an erosion of workers’ labor market leverage (sometimes referred to as growing monopsony power on the part of employers) and rising monopolization. This post will discuss the first one, one tomorrow will tackle monopoly.
Two punchlines to this discussion are simple enough to highlight:
Why is wage growth so slow? It’s not because low-wage jobs are being added disproportionately
Despite an unemployment rate that averaged 4.1 percent over the last 12 months, the average real (inflation-adjusted) wage of private sector workers did not grow at all over this period. Part of the reason is an increase in energy prices, which is likely to be temporary, but our slow wage growth has mostly been driven by nominal wages failing to rise quickly even in the face of low unemployment.
One explanation worth looking into is whether today’s low wage growth is due to a composition effect—i.e. low-wage jobs being added faster than middle- and/or high-wage jobs and, as a result, pulling down wage growth.
Composition was certainly a factor during the early part of the recovery from the Great Recession. In the first few years of the recovery, the jobs being added were very disproportionately low-wage jobs, which had the effect of pulling wage growth down over that period. But since 2013, as the recovery has strengthened, the opposite has been true—low-wage jobs are actually declining on net while middle and high wage jobs are being added, which has the effect of raising average wages. In other words, the composition effect is currently putting upward pressure on wages.
Why is real wage growth anemic? It’s not because of a skills shortage
Despite an unemployment rate at 4.1 percent or less since last October, wage growth has been anemic. In fact, over the last year, the average real wage of private sector workers saw no growth at all. While the total lack of growth in inflation-adjusted (real) wages over the last year is due in part to an increase in energy prices that is likely temporary, the slow real wage growth we’ve seen in recent years is mostly driven by nominal wages failing to rise quickly even in the face of low unemployment.
Some have posited that our far-less-than-stellar wage growth right now could be due to workers not having the skills employers need. But that idea has the logic backwards. When employers can’t find workers with the skills they need at the wages they are offering, they will raise wages in order to attract qualified workers—if employers can’t find the workers they need among the unemployed, they will offer higher wages in an attempt to poach needed workers from other firms, who will then raise wages in an attempt to keep their workers, and so on. In other words, if there are skills shortages, we should see signs of faster wage growth for workers with needed skills. This fast wage growth for skilled workers should push up average wages, not weigh them down. Since we continue to see anemic average wage growth, not just slow wage growth for select groups of workers, it’s clear that there is not a widespread shortage of the types of workers (i.e., those with the right skills) that employers need.
But we certainly hear widespread employer complaints about not being able to find workers. Why? One reason is monopsony power in the U.S. labor market. There is a lot of evidence that many firms have monopsony power, either because of a limited number of buyers of labor or other sources beyond labor market concentration. When firms have monopsony power, they are able to pay workers less than what their work is “worth,” i.e. less than their marginal product. But a key dynamic of monopsony power is that even though monopsonists would like to hire more workers, the low wages they offer mean they can’t attract more workers unless they pay more. That is, it is a normal state of affairs for a firm with monopsony power to wish they could hire more workers at the wages they are offering, but to be unable to attract additional workers because their wages are too low. So when a firm with the power to set wages below a workers’ marginal product complains about not being able to find workers at the wages they are offering, it’s useful to remember that they are choosing to keep wages low in order to increase profits—which remain high as a share of corporate sector income—and could get more workers by simply raising wages. And importantly, when firms with monopsony power complain about not being able to find workers, it is not adequate evidence of a skills shortage.
Average wage growth continues to flatline in 2018, while low-wage workers and those with relatively lower levels of educational attainment see stronger gains
Real (inflation-adjusted) average hourly wages from the Current Employment Statistics (CES) survey did not grow at all between June 2017 and June 2018. This is not only troubling, but mildly surprising given the historically low unemployment rate of 4.0 percent. Some of this real wage stagnation can be explained by an uptick in energy prices, but even the underlying pace of nominal wage growth has yet to pick up in the way it historically has as labor markets tightened. It’s likely that the unemployment rate is overstating the strength of the economy given still soft labor force participation and the prime-age employment-to-population ratio. Even so, a steadily improving economy should eventually translate into stronger wage growth. And, if there were any thoughts that those tax cuts were going to lead to faster wage growth, which was doubtful in the first place, zero wage growth certainly isn’t a compelling case.
But the CES is only one measure of wage growth. Its large sample size and benchmarking make it one of the most reliable measures, but it only provides information on average wages for very large groups of workers (all workers or the 82 percent who are non-supervisory). The Current Population Survey-Outgoing Rotation Group (CPS-ORG) allows us to see what’s happening at different parts of the wage distribution and for workers with varying levels of educational attainment. Because of the volatility in the CPS-ORG, we’ve constructed annual averages for the year ending in June of each year, combining first half data in the stated year with second half data in the prior year. All wages are in first half 2018 dollars. Using this metric, real average hourly wages in the CPS-ORG grew 1.2 percent between 2017 and 2018. Table 1 below shows real wages by wage percentile for 2000, 2007, 2017, and 2018, with annualized changes between each set of years shown at the bottom of the table.
Hourly wages by wage percentile, 2000–2018 (FH2018 dollars)
| Wage by percentile | ||||||||||
|---|---|---|---|---|---|---|---|---|---|---|
| Year | 10th | 20th | 30th | 40th | 50th | 60th | 70th | 80th | 90th | 95th |
| 2000 | $9.09 | $11.20 | $13.11 | $15.10 | $17.89 | $20.97 | $24.80 | $30.05 | $39.23 | $50.07 |
| 2007 | $9.30 | $11.36 | $13.27 | $15.61 | $18.20 | $21.54 | $25.41 | $31.12 | $41.87 | $53.82 |
| 2017 | $9.85 | $11.44 | $13.47 | $15.60 | $18.63 | $21.96 | $26.45 | $33.41 | $46.19 | $60.95 |
| 2018 | $10.06 | $11.90 | $13.89 | $15.95 | $18.72 | $22.00 | $26.56 | $33.62 | $46.49 | $62.26 |
| Annualized percent change | ||||||||||
| 2000–2007 | 0.3% | 0.2% | 0.2% | 0.5% | 0.2% | 0.4% | 0.3% | 0.5% | 0.9% | 1.0% |
| 2007–2018 | 0.7% | 0.4% | 0.4% | 0.2% | 0.3% | 0.2% | 0.4% | 0.7% | 1.0% | 1.3% |
| 2017–2018 | 2.2% | 4.0% | 3.1% | 2.3% | 0.5% | 0.2% | 0.4% | 0.6% | 0.7% | 2.2% |
| 2000–2018 | 0.6% | 0.3% | 0.3% | 0.3% | 0.3% | 0.3% | 0.4% | 0.6% | 0.9% | 1.2% |
Note: The xth-percentile wage is the wage at which x% of wage earners earn less and (100-x)% earn more.
Sample based on all workers ages 18–64. Each year represents annual data, calculated using the first-half data in the listed year combined with the second-half data for the prior year.
Source: EPI analysis of Current Population Survey microdata
Real hourly wage growth over the last year is relatively polarized, with the strongest growth among the bottom 40 percent of workers along with those at the 95th percentile. More broad based growth, with particularly strength at the bottom of the wage distribution, is expected as we continue to move toward full employment. When the unemployment rate falls, even as more workers are drawn into the labor market, available workers of all types become scarcer and employers have to increase wages to attract and retain the workers they want. Lower unemployment has, in the past, benefited low-wage workers more than middle-wage workers and middle-wage more than higher-wage workers. In addition, in the last three to four decades of growing inequality, high-wage workers have had more leverage to bid up their wages faster than others. That trend has continued through the 2000s.Read more
What to Watch on Jobs Day: Public sector jobs are threatened by austerity and attacks on collective bargaining
Last week, the U.S. Supreme Court ruled on Janus v. AFSCME Council 31. The Court’s 5-4 decision bars unions from requiring state and local government workers who benefit from union representation to pay their fair share of that representation. As a result, public sector unions will be up against a classic free rider problem, in which all the workers in a bargaining unit will be legally entitled to union representation, even if they don’t pay a penny for the benefits and services the union provides. This decision will have profound implications for all state and local government workers throughout the country, not just the share covered by a union contract.
To get a sense of the number of workers directly affected by this decision, let’s take a look at state and local government employment. According to the Current Employment Statistics survey, there are nearly 20 million state and local workers in the economy today. This represents about 13 percent of the overall workforce. The majority of these state and local workers are in the education sector. State and local education workers top 10 million, representing 53 percent of all state and local government workers.
At the same time as attacks on public sector collective bargaining erode compensation and job quality, austerity has held back employment and wage growth. State and local workers—such as the teachers in West Virginia and Oklahoma who were recently protesting not just their low wages but lack of funding in the classroom—have already been hammered by years of austerity policy at all levels of government. In states like Wisconsin, tax cuts for the most well off in the early 2010s were financed by the layoffs and cuts to public employees’ wage and benefits. As of the beginning of this school year, local public education employment was still lower than it was before the Great Recession, and much lower than where it could be if employment had kept up with the growth in school enrollment. This means, in this past school year, we experienced a shortfall of over 300,000 public educators.
Social Security data confirm same old pattern: Self-employment headcount has risen but economic impact remains small
One indication of the growth of self-employment activity has been the rise in the number of people filing Schedule C income and self-employment earnings in their annual tax filings. This growth has been cited to illustrate the escalation of self-employment and to suggest that Bureau of Labor Statistics (BLS) measures of self-employment are missing an important phenomenon. Tracking headcounts of tax filings, however, does not adequately reflect trends in the economic impact of self-employment since, as this analysis shows, most of the growth is activity for supplementary incomes.
Our analysis of self-employment earnings data from the Social Security Administration (SSA) through 2015 (the latest data) confirms previous general findings regarding Uber drivers, independent work, all online demand platform work, nonemployer establishments, and independent contractors more generally. These previous findings are:
- The number of people involved in these types of work activity has increased;
- The increase is primarily among people who are doing so to earn supplementary income and for a short amount of hours. The increase in the various self-employment activities has not occurred in people’s “main job” or as their main source of income; and
- The economic scale of these activities has not changed much when measured as a share of economy-wide total hours worked, earnings, or compensation. While headcount measures of self-employment activity do show a large increase, the overall economic impact of this activity is relatively small in scale and growth.
The following table summarizes SSA data through 2015, the most recent year available, by “type of earnings”, meaning it distinguishes between those with regular W-2 earnings and those with self-employment earnings: the data show the number of individuals with each type of income and the amount of earnings from each type of earnings. Note that in any given year or at any particular point in time, workers can have income both from regular W-2 employment and from self-employment. One indication of this is that the sum of W-2 filers and the self-employed exceeds the total number of workers, indicating that about 40 percent of self-employed also filed a W-2.Read more
Janus decision is not about union finances—it’s about working people’s finances
Today, the Supreme Court issued its final opinions from October Term 2017. This ends a particularly devastating term for working people—and for our democracy. One of the most troubling elements of the decisions impacting workers is the court’s repeated undermining of workers’ ability to act collectively in addressing workplace issues. This can be seen in the both Epic Systems Corp. and Janus. Corporate interests have long fought to erode the right of workers’ to join together. The Supreme Court certainly advanced this attack this term.
It is likely that the small group of foundations with ties to the largest and most powerful corporate lobbies that are behind the Janus case feel validated by today’s opinion that shamefully safeguards their interests by contorting the First Amendment. However, this victory will be short lived. Working people in this country know that the economy is not working for them. Today’s decision is likely to make that more true, but at the same time, it has already made workers’ right to a union and collective bargaining a topic covered by cable news and in newspapers throughout the country—a feat in and of itself. As was seen in the reaction to the teachers’ strikes in West Virginia, Oklahoma, and beyond, when issues of economic justice and workers’ rights are put front and center, the interests of the wealthy few rarely prevail.
Much will be said of Janus and its impact on unions—particularly union finances. But today’s decision is really about working people’s finances—our wages and our benefits. Unions provide a means for working people to come together and ensure that we are paid fairly and treated with dignity on the job. Unions are fundamental to a fair economy. Union membership cuts not just across political party affiliation, but also across race, gender, and ethnicity, ensuring that often marginalized voices are represented. Unions also provide an effective, organized voice for working people in our political process—helping to win minimum wage increases and civil rights protections for all working people. Today, millions of men and women in this country are union members, and millions more view unions favorably. Over half of all Americans say that the decline in union representation has been bad for working people in the United States. The Supreme Court today focused on fair share fees, but the focus going forward must be on a fair economy for working people and unions are clearly a critical part of that fight.
Workers of color are far more likely to be paid poverty-level wages than white workers
Marking the 50th anniversary of the 1968 Poor People’s Campaign, EPI has described the potential to reduce poverty through work, provided there are jobs with decent wages and adequate hours available to everyone who can and wants to work. Unfortunately, even when jobs are available, workers are often paid so little that they can still be left in poverty. Today, one in nine U.S. workers are paid wages that would leave them in poverty for their family size if they are the sole earner in their family—even with a full-time, year-round schedule.
Although the share of workers earning poverty wages has declined over the past three decades, there are still large racial and ethnic differences in the shares of workers being paid at adequate wage levels. As shown in the first figure below, workers of color are far more likely to be paid poverty-level wages than white workers. In 2017, 8.6 percent of white workers were paid poverty wages—i.e., hourly wages that would leave them below the federal poverty guideline for their family size if they are the sole earner in the family, even if they work full-time, year-round. In contrast, 19.2 percent—nearly one in five—Hispanic workers were paid poverty wages, and 14.3 percent—roughly one in seven—black workers were paid poverty wages. Asian or Pacific Islander workers also had higher poverty-wage rates than white workers, at 10.9 percent.
Workers of color are far more likely to be paid poverty-level wages than white workers: Share of workers earning poverty-level wages, by race/ethnicity, 1986–2017
| Year | White | Black | Hispanic | Asian/P.I. |
|---|---|---|---|---|
| 1986 | 15.4% | 23.5% | 28.3% | |
| 1987 | 14.6% | 22.5% | 27.7% | |
| 1988 | 14.4% | 21.8% | 26.9% | |
| 1989 | 13.5% | 21.0% | 26.6% | 16.8% |
| 1990 | 14.5% | 22.7% | 30.2% | 18.3% |
| 1991 | 14.4% | 22.7% | 30.7% | 18.7% |
| 1992 | 14.6% | 22.4% | 30.9% | 19.2% |
| 1993 | 14.4% | 22.1% | 31.2% | 18.6% |
| 1994 | 14.8% | 22.3% | 33.1% | 19.3% |
| 1995 | 14.8% | 21.8% | 34.2% | 20.0% |
| 1996 | 13.9% | 22.0% | 32.2% | 19.9% |
| 1997 | 13.9% | 21.8% | 33.5% | 20.4% |
| 1998 | 12.6% | 18.7% | 30.8% | 18.3% |
| 1999 | 12.0% | 18.2% | 29.6% | 17.1% |
| 2000 | 10.8% | 16.2% | 28.1% | 15.4% |
| 2001 | 10.4% | 16.0% | 27.1% | 13.4% |
| 2002 | 10.3% | 15.3% | 26.5% | 14.2% |
| 2003 | 10.0% | 14.6% | 24.7% | 12.8% |
| 2004 | 10.7% | 15.0% | 26.0% | 14.1% |
| 2005 | 10.2% | 15.5% | 25.6% | 13.7% |
| 2006 | 9.8% | 14.1% | 24.3% | 12.2% |
| 2007 | 9.9% | 14.7% | 23.9% | 12.5% |
| 2008 | 10.1% | 15.1% | 23.0% | 13.0% |
| 2009 | 11.1% | 15.2% | 25.6% | 12.5% |
| 2010 | 10.5% | 14.7% | 26.0% | 13.1% |
| 2011 | 10.6% | 14.9% | 25.3% | 13.1% |
| 2012 | 11.2% | 16.6% | 26.6% | 14.4% |
| 2013 | 11.0% | 16.4% | 26.1% | 14.0% |
| 2014 | 11.1% | 17.8% | 24.6% | 13.1% |
| 2015 | 10.7% | 16.8% | 24.9% | 14.0% |
| 2016 | 9.6% | 15.4% | 21.0% | 11.8% |
| 2017 | 8.6% | 14.3% | 19.2% | 10.9% |
Notes: A “poverty-level wage” is a wage that would leave a full-time, year-round worker below the federal poverty guideline for their family size if they are the sole earner in the family. Poverty wage thresholds are specific to each family size, and family sizes are calculated using the total number of people in each family or subfamily within the CPS data. The "Asian or Pacific Islander" race category is only available beginning in 1989.
Source: EPI analysis of Current Population Survey Outgoing Rotation Group microdata
Among workers of all races and ethnicities, the shares being paid poverty wages have declined from highs reached in either the mid-1980s or the mid-1990s. However, the share of black workers earning poverty wages in 2017 (14.3 percent) was still slightly above where it was in 2006 (14.1 percent.) Black workers are the only group for whom the share receiving poverty wages is not at its lowest level on record.
Notably, racial gaps have been remarkably consistent—if not gotten worse—over time. The share of black workers earning poverty-level wages has consistently been 1.5 times that of white workers for the entirety of the series. The ratio of the Hispanic poverty-wage rate to the white poverty-wage rate has actually grown since the 1980s. In 1986, the share of Hispanic workers earning poverty-level wages was 1.8 times that of white workers; in 2017, it was 2.2 times the share of white workers.Read more
Nonemployer establishments grew in 2016 but their real revenues were stable: This confirms other data on self-employment showing more activity, but little economic impact
Last week’s release of the new Bureau of Labor Statistics (BLS) Contingent Worker Survey (CWS) has renewed public interest in tracking the number of self-employed or independent contractors. Today’s release of the U.S. Census nonemployer establishment data for 2016 provides another useful data point about the trends in self-employment.
Our analysis of these new nonemployer establishment data affirm the pattern seen through 2015. As we wrote yesterday: these data confirm previous general findings regarding Uber drivers, all online demand platform work, and independent contractors more generally. These previous findings are:
- There is an increase in the amount of people involved in self-employment or online platform types of work activity;
- The increase is primarily among people who are doing so to earn supplementary income and for a short amount of hours. The increase in the various self-employment activities has not occurred in people’s “main job” or as their main source of income; and
- The economic scale of these activities has not increased greatly when measured as a share of hours worked or compensation earned. While “headcount” measures do show a large increase, the overall economic impact is relatively small.
As we show, there has been a significant increase in the headcount of nonemployer establishments. However, the economic impact, as measured by the share of nonemployer establishment revenues in total revenues, has not increased in roughly 20 years. Nonemployer establishments grew by 2.0 percent from 2015 to 2016 but their real revenues grew by just 0.2 percent, evidence of a very small economic impact. In fact, over the medium term there has been a slight decline in the nonemployer establishment share of all revenue between 2007 and 2016, from 3.3 to 3.1 percent of all revenue. This indicates that the growth of nonemployer establishments seems to reflect the growth of self-employed individuals operating unincorporated businesses that generate very little revenue, including the period since 2011 when Uber, Lyft, and other online platform work expanded rapidly.Read more
Has self-employment surged? Data on nonemployer establishments confirm other data showing more activity, but not much economic impact
Update: Read the analysis of 2016 nonemployer establishment data.
Last week’s release of the new Bureau of Labor Statistics (BLS) Contingent Worker Survey (CWS) has renewed public interest in tracking the number of self-employed or independent contractors. The upcoming release of the U.S. Census nonemployer establishment data for 2016 this Thursday will provide another useful data point about the trends in self-employment.
Our analysis of nonemployer establishment data through 2015 indicates that these data confirm previous general findings regarding Uber drivers, all online demand platform work, and independent contractors more generally. These previous findings are:
- There is an increase in the amount of people involved in these types of work activity;
- The increase is primarily among people who are doing so to earn supplementary income and for a short amount of hours. The increase in the various self-employment activities has not occurred in people’s “main job” or as their main source of income; and
- The economic scale of these activities has not increased greatly when measured as a share of hours worked or compensation earned. While “headcount” measures do show a large increase, the overall economic impact is relatively small.
As we will show, there has been a significant increase in the headcount of nonemployer establishments. However, the economic impact, as measured by the share of nonemployer establishment revenues in total revenues, has not increased in roughly 20 years. This indicates that the growth of nonemployer establishments seems to reflect the growth of self-employed individuals operating unincorporated businesses that generate very little revenue.
Background on CWS and nonemployer data
The CWS is based on a household survey and showed that in 2017, the share of independent contractors in total employment was 6.9 percent, comparable to what was reported in all of the other CWS surveys back to 1995. This has elicited surprise by many observers, especially those that have touted the explosion of gig work or freelancing.
The release of new Census data on nonemployer establishments for 2016 this month provides another opportunity to track these trends. These Census data capture the phenomenon of self-employment by examining business establishment/firm data rather than asking individual workers or households about employment. Census describes the data as:
“data for businesses that have no paid employees and are subject to federal income tax. Most nonemployers are self-employed individuals operating unincorporated businesses (known as sole proprietorships), which may or may not be the owner’s principal source of income.”
Various analysts have used these data to track the rise of self-employment with many arguing that the rapid rise of nonemployer establishments reflect a surge of self-employment and gig work. Abraham et al. (2017) note that the growth of nonemployer establishments was faster than self-employment in the Current Population Survey (CPS). They cite this evidence (along with tax records) as being consistent with the argument that the CPS is missing some of the growth of in self-employment, pointing out that nonemployer establishments “have trended upwards as a percent of the number of earners.” Steve King of Emergent Research, a leading analyst of gig and “independent worker” trends, has also said that nonemployer data are “a useful general indicator of U.S. self-employment.”
All of the analyses we have seen of these data solely focus on headcount measures, tracking the number of nonemployer establishments, and do not examine the economic impact, as we do in our analysis by examining the revenues of nonemployer establishments.
This may be surprising since the Census used to (but now does not) warn data users of the following:
“The majority of all business establishments in the United States are nonemployers, yet these firms average less than 4 percent of all sales and receipts nationally. Due to their small economic impact, these firms are excluded from most other Census Bureau business statistics.”Read more
How big is AI-related employment? Not that big at all—despite what Stanford’s AI Index Annual Report tries to claim
There is much discussion about the potential for artificial intelligence (AI) to transform our workplaces, possibly leading to fewer overall jobs and greater economic inequality in the future. This discussion has always made me wonder to what extent AI is already being used to produce goods and services. So, I was excited to learn about the AI Index from reading the recent Furman and Seamans paper on “AI and the Economy.” Furman and Seamans write: “The AI index, a non-profit project designed to track activity and progress in AI, provides a number of interesting facts designed to track the scientific progress in and impact of artificial intelligence and robotics.” I was even more excited to see the AI index reporting on “the growth of the share of US jobs requiring AI skills.” However, my excitement soon ended when I realized that the information they offered completely obscured the (lack of) importance of the underlying data, and I have to reluctantly conclude that the AI index offers extremely misleading hype on AI jobs rather than useful information. I am getting tired of overhyped phenomena, so this blog post is to alert the public.
The AI Index highlights the fact that “the share of jobs requiring AI skills in the US has grown 4.5x since 2013” (see the graph below). That sounds like a huge explosion of jobs related to AI, right? But exactly how many jobs are they talking about being AI-related now compared with in the past? One cannot tell from their information, because while it shows the growth in the share of AI jobs, it provides no information of the level of these shares (either now or in the past). I am always careful to not present data showing the percent changes of percentages, because this is often misleading. For example, when a share rises from 1 percentage point to 2 percentage points, it has risen 100 percent. If a share rises from 20 percentage points to 22 percentage points, it has only risen by 10 percent. Yet in the latter example the change in the level of the share is twice as large (2 percentage points, compared to 1). So what does it tell us about the share of AI jobs in the economy today to tell us that this share has grown 350 percent, without telling us the initial level of the share? Absolutely nothing.
CEO pay: Still not related to performance
This post originally appeared on the CEPR blog.
Earlier this year we did an analysis of CEO compensation in the health insurance industry to see if it was affected by the cap on deductibility imposed by the Affordable Care Act (ACA). One of the provisions of the ACA limited the amount of CEO pay that health insurers could deduct on their taxes to $500,000, beginning in 2013.
This provision effectively raised the cost of CEO pay to insurers by more than 50 percent. Prior to 2013, the deduction in effect meant that the government was picking up 35 cents of every dollar of CEO pay, while the companies were paying just 65 cents. 1 With the new provision in place, insurers are now paying 100 cents of every dollar of CEO pay in excess of $500,000.
If the pay reflects the value of the CEO to the company, we should expect this change to reduce the pay of CEOs in the insurance industry. For example, if a CEO gets paid $20 million a year, this should mean that she delivers roughly $20 million in additional value to shareholders.
When the CEO’s pay was fully deductible, the $20 million paid to the CEO actually only cost the company $13 million. This would presumably be the number that matters to shareholders since they care about how much money comes out of their pockets, not the number on the CEO’s paycheck.
Why is wealthy Westport trying to gut police pensions?
Police in Westport, Connecticut are resisting an attempt to slash their pension and partially replace it with a 401(k)-style plan. Such a move would mess with a tried-and-true system that promotes secure and orderly retirement, in favor of an inefficient one that harms workers with no benefit to taxpayers.
Westport is a latecomer to a trend that appears to have nearly run its course. A few years ago, the Wall Street Journal praised San Jose Mayor Chuck Reed for taking an axe to police and other public employee pensions. Along with Rhode Island Treasurer (later Governor) Gina Raimondo, Reed had become a public face of the pension gutting movement, leading a statewide initiative backed by hedge fund billionaires. Reed and Raimondo, both Democrats, were lauded by conservative think tanks and the Journal for taking on public-sector unions, ignoring the fact that they were courting more powerful interests—the financial industry and wealthy donors.
Similar initiatives followed in Dallas, Memphis, and Palm Beach, among other places. But as the Journal reported last year, in an apparent change of heart, cities that slashed police pensions were later forced to restore benefits or spend millions on retention bonuses in efforts to stem outflows of experienced officers. In Palm Beach, for example, 24 mid-career police officers left in the four-year period after the city cut police and firefighter pensions and partly replaced them with 401(k)-style plans, compared with just one mid-career officer in the previous four years. The exodus of police and firefighters to neighboring jurisdictions caused the city to incur millions in additional training and overtime costs. Five years later, the city reversed course, restoring pension benefits and dropping the 401(k)-style plans.
Social Security trustees report shows why we should expand the program—not look for excuses to cut it
There’s no real news in the Social Security trustees report released this afternoon. We’re now a year closer to the date the trust fund will be exhausted, 2034 (same as last year’s projection), at which point current revenues will still be sufficient to cover 77 percent of benefits even if nothing is done to shore up the system’s finances. Each year, the release of the trustees report provides an occasion for Social Security scaremongering by those wanting to shrink our social insurance system. But not only can we afford current benefits, we can afford to expand them.
The average retired worker beneficiary receives an annual benefit of $16,933. Disability and survivor benefits are even more modest. Social Security benefits are replacing a declining share of income at retirement, thanks to a rising normal retirement age and increased taxation of benefits—cuts passed in 1983 that are gradually taking effect (an increase in the retirement age is really just an across-the-board benefit cut that can be offset by retiring later). Rising Medicare premiums, which are deducted from Social Security, also reduce net benefits.
Despite these trends, recent Census research has found that retirees are somewhat better off than previously thought, thanks to income from traditional defined benefit pensions that is underreported in household surveys. Nevertheless, Social Security remains by far the most important source of income for most seniors. It constitutes most of the income of seniors in the bottom half of the income distribution and is the single biggest source of income for all but those in the ninth and tenth income deciles, for whom defined benefit pensions and earned income loom larger.
Seven facts about tipped workers and the tipped minimum wage
As debate continues on a referendum to raise the tipped minimum wage in Washington, D.C., to the minimum wage for nearly all other workers, we wanted to take a few minutes to set the record straight on the facts about tipped worker wages and incomes. Currently, eight states do not have differential treatments of the tipped workforce in terms of the minimum wage.1 Throughout this post, these will be referred to as “equal treatment” states. To be clear, tipped workers in these equal treatment states receive the full, regular state minimum wage plus tips.
Over the last several years, there has been a great deal of research about the minimum wage and tipped restaurant workers, in particular, and we are going to draw on some of that research to make several key points: 1. In the District of Columbia, women, African American, and Hispanic workers are disproportionately minimum wage workers, including tipped minimum wage workers; 2. Maintaining a separate, lower minimum wage for tipped workers perpetuates racial and gender inequities; 3. In states that have a lower tipped minimum wage, tipped workers have worse economic outcomes and higher poverty rates than their counterparts in equal treatment states; 4. Tipped work is overwhelmingly low-wage work, even in D.C.; 5. Wage theft is particularly acute in food and drink service, and restaurants across the country have been found to be in violation of wage and hour laws; 6. Waitstaff have higher take-home pay in equal treatment states than in D.C.; and 7. The restaurant industry thrives in equal treatment states.
Here, we take a closer look at each point:
1. Women, African Americans, and Hispanic workers have disproportionately benefited from minimum wage increases in Washington, D.C. Furthermore, contrary to popular opinion, the vast majority of minimum-wage earners are not teenagers or college students working part-time jobs.
2. Research indicates that having a separate, lower minimum wage for tipped workers perpetuates racial and gender inequities, and results in worse economic outcomes for tipped workers. Forcing service workers to rely on tips for their wages creates tremendous instability in income flows, making it more difficult to budget or absorb financial shocks. Furthermore, research has also shown that the practice of tipping is often discriminatory, with white service workers receiving larger tips than black service workers for the same quality of service.
What to Watch on Jobs Day: Signs of stronger wage growth that will eventually improve Americans’ livings standards
Although in last month’s jobs report we saw a fall in the unemployment rate accompanied by a drop in labor force participation—which showed the unemployment rate dropping for the wrong reasons—the longer-term trends suggest that displaced workers continue to return to the labor market. This is to be expected as the labor market improves, and what we’ve been expecting for years. The unemployment rate of 3.9 percent seems to be overstating the strength of the labor market given how many sidelined workers appear to want jobs. Furthermore, upwards of 70 percent of the newly employed are coming from out of the labor force as opposed to those “actively” looking for work, that is, among those officially counted in the U3 unemployment rate. We only need to look as far as nominal wage growth to know that we are not yet unambiguously at full employment. Employers and workers alike seem to recognize the slack out there and workers still do not have sufficient leverage to bid up their wages. Year-over-year nominal wage growth has averaged 2.6 percent over the last couple of years, consistently below target levels.
Unfortunately, nominal wage growth for private-sector workers found in the monthly jobs report’s payroll survey offers only a limited view on wage growth in the economy today. One of the major benefits of a full employment economy is that wage growth isn’t simply strong for workers at the top of the wage distribution or for workers with more educational attainment, but that it allows low-wage workers to make gains as well. To get finer-grained estimates of what’s happening to wage growth for particular groups of workers, we have to turn to the Current Population Survey Outgoing Rotation Group (ORG). The ORG is a household-based survey, not an employer-based one like the payroll survey, which each month provides widely reported estimates of job growth and wage growth for private-sector workers. This is important because this means the ORG can not only ask questions of wages, but also make comparisons of wages across the wage distribution. Adding to that information gleaned from the Current Population Survey Annual Social and Economic Supplement (CPS ASEC) allows for comparisons about incomes, notably information on poverty rates.
Over the last couple of weeks, EPI has been highlighting some important statistics in commemoration of the 50th anniversary of the Poor People’s Campaign. We’ve pointed out the changes in the poverty rate over the last 50 years, where gains have been made, particularly among the elderly, and where disparities remain. We also discussed how poverty reduction can be improved with a stronger safety net and a better labor market. The truth is that full employment that makes more hours available to lower-wage workers and broad-based wage growth are key tools in the fight against poverty, and many people who live below the poverty line rely on a stronger economy to make ends meet.
Ending individual mandatory arbitration alone fails most workers: For real worker power, end the ban on class and collective action lawsuits
Uber made news yesterday when the company announced that it will end mandatory arbitration for sexual harassment and assault complaints. Lyft quickly followed suit and said that it would also do away with mandatory arbitration agreements for sexual misconduct claims. These companies are the latest in a growing number of corporations that have moved to eliminate mandatory arbitration agreements for sexual harassment claims. There is no doubt that these companies are being driven to action by the power of #MeToo and #TimesUp. And, while a move away from mandatory arbitration by firms like Uber and Microsoft should be celebrated as a victory for these movements, it is important to recognize that for women in low-wage jobs, challenging workplace sexual harassment and assault remains largely impossible, unless companies also end bans on class and collective action.
Workers depend on class and collective actions to enforce many workplace rights. Employment class action cases have helped to combat race and sex discrimination and are fundamental to the enforcement of wage and hour standards. Without the ability to aggregate claims, it would be very difficult, if not impossible, for workers to find legal representation in these matters. This is particularly true for low-wage workers, whose cases are unlikely to involve large enough awards to attract attorneys to invest time in the case. That is the power of class and collective action suits: they let workers pool their claims, making it possible for an attorney to earn enough to make the case worth pursuing.
Banning mandatory arbitration in sexual harassment and sexual assault claims but continuing to restrict class and collective action will do little to help women in low-and middle-wage jobs access justice when they face sexual harassment or assault. These women will still face challenges finding legal representation and find the cost of litigation prohibitive. And it will do nothing to help women facing other kinds of workplace violations. This is especially concerning considering the majority of low-wage workers in the United States are women. And research shows that low-wage workers in the United States lose more than $50 billion annually as a result of wage theft by their employers. Workers have the right to a workplace free of sexual harassment as well as their right to be paid fairly, and creating a hierarchy of worker protection laws by privileging certain types of claims over others is fundamentally unjust—particularly for low-wage workers. Companies should not be applauded for such a minimal response to workplace misconduct and advocates should not be fooled into seeing this as a solution.
Our nation’s labor and employment laws need reform. A key element of reform must be to end employers’ ability to require workers to sign away their rights as a condition of employment. The Supreme Court will soon decide National Labor Relations Board v. Murphy Oil USA, which will determine whether employers can lawfully require workers to sign arbitration agreements that include class and collective action waivers. If the Court denies workers this fundamental right, Congress must act to protect it. If policymakers leave the solution to corporations, we will end up with a system that privileges some claims and fails most workers.
As cities and states pass bold increases in the minimum wage, we need to update our thinking about its costs
The last few years has seen a major shift in minimum wage policies as states like California and New York and cities like Seattle and Washington, DC, have passed laws phasing in a $15 minimum wage, targeting bolder increases than had been the pattern over the last two decades. Federal proposals such as the Raise the Wage Act of 2017, which would bring the minimum wage to $15 by 2024, are consistent with these bolder local approaches. This is bold, as it mandates a 71.9 percent real increase in the minimum wage. But even this bold increase only brings the minimum wage to 29 percent above its 1968 purchasing power, despite productivity nearly doubling over the same timeframe. Many policymakers have concluded, in effect, that years of modest or no change in the minimum wage have created a situation where bold increases are required just to move the minimum wage closer to being a living wage.
This shift in policy now necessitates a rethinking of the flawed way we have evaluated minimum wage increases over the last few decades. There have been, in particular, two flaws. One was first highlighted by economists Fiedler, Howell, and Luce, who noted that public discussion of various minimum wage proposals, including among economists, tends to center solely on whether there will be any job loss. In effect, minimum wage proposals are being evaluated according to a “no job loss” criterion, which specifies that the “right” wage floor is the one that previous research has demonstrated will pose little or no risk of future job loss, anywhere.” A no job loss criterion implies that if a minimum wage increase has any costs (whether loss of employment or work hours), regardless of benefits, then it is inappropriate.
Minnesota and Wisconsin had similar job growth trajectories leading up to the Great Recession, but not after it
Earlier this week, EPI released an analysis of economic performance in Wisconsin and Minnesota since 2010, which showed that by virtually every available measure, Minnesota has outperformed Wisconsin. This is notable because lawmakers in the two states adopted vastly different policy agendas coming out of the recession. Wisconsin adopted a highly conservative agenda of cutting taxes, shrinking government, and weakening unions. Minnesota, in contrast, enacted many key progressive priorities: raising the minimum wage, strengthening safety net programs and labor standards, and boosting public investment in infrastructure and education, financed by raising taxes, primarily on the wealthy.
Skeptical readers might argue that as much as the two states are similar, they are sufficiently different such that the diverging economic outcomes observed in our report are the result of fundamental differences in the two states’ economies and that state policy decisions were largely irrelevant. I think there’s ample evidence to indicate that such readers are wrong. In the paper, I discuss some of the policy decisions—such as those around Medicaid expansion, investment in infrastructure, and worker organizing—where one can draw a fairly straight line from the policy decision to the observed economic result. I also note that wage growth was actually stronger in Wisconsin than Minnesota in the seven years prior to Great Recession.
It’s also instructive to compare job growth in the two states in the economic expansion prior to the Great Recession. The data suggest that whatever their differences, prior to the recession, Wisconsin and Minnesota followed a very similar trajectory for employment growth.
Minnesota and Wisconsin had similar job growth trends leading up to the Great Recession, but not after it: Employment levels relative to the start of Governor Walker and Governor Dayton’s terms (Jan 2011)
| UNITED STATES | Minnesota | Wisconsin | |
|---|---|---|---|
| Nov-2001 | 100.2% | 100.5% | 101.6% |
| Dec-2001 | 100.1% | 100.2% | 101.3% |
| Jan-2002 | 100.0% | 100.2% | 101.5% |
| Feb-2002 | 99.9% | 100.2% | 101.5% |
| Mar-2002 | 99.9% | 100.0% | 101.5% |
| Apr-2002 | 99.8% | 100.0% | 101.4% |
| May-2002 | 99.8% | 100.0% | 101.4% |
| Jun-2002 | 99.9% | 100.1% | 101.4% |
| Jul-2002 | 99.8% | 100.3% | 101.3% |
| Aug-2002 | 99.8% | 100.1% | 101.4% |
| Sep-2002 | 99.7% | 100.3% | 101.2% |
| Oct-2002 | 99.8% | 100.0% | 101.6% |
| Nov-2002 | 99.8% | 100.2% | 101.8% |
| Dec-2002 | 99.7% | 100.0% | 101.5% |
| Jan-2003 | 99.8% | 100.1% | 101.2% |
| Feb-2003 | 99.7% | 100.1% | 101.3% |
| Mar-2003 | 99.5% | 100.0% | 101.1% |
| Apr-2003 | 99.5% | 100.1% | 101.2% |
| May-2003 | 99.5% | 100.1% | 101.2% |
| Jun-2003 | 99.5% | 99.9% | 101.1% |
| Jul-2003 | 99.5% | 99.9% | 100.7% |
| Aug-2003 | 99.5% | 100.0% | 100.7% |
| Sep-2003 | 99.5% | 100.0% | 100.9% |
| Oct-2003 | 99.7% | 99.8% | 101.3% |
| Nov-2003 | 99.7% | 99.7% | 101.3% |
| Dec-2003 | 99.8% | 99.9% | 101.4% |
| Jan-2004 | 99.9% | 99.8% | 101.5% |
| Feb-2004 | 100.0% | 99.9% | 101.6% |
| Mar-2004 | 100.2% | 100.0% | 101.7% |
| Apr-2004 | 100.4% | 100.6% | 101.8% |
| May-2004 | 100.6% | 100.8% | 102.0% |
| Jun-2004 | 100.7% | 100.8% | 102.1% |
| Jul-2004 | 100.7% | 100.8% | 102.5% |
| Aug-2004 | 100.8% | 100.9% | 102.8% |
| Sep-2004 | 100.9% | 101.0% | 102.4% |
| Oct-2004 | 101.2% | 101.3% | 102.8% |
| Nov-2004 | 101.3% | 101.3% | 102.8% |
| Dec-2004 | 101.4% | 101.4% | 102.8% |
| Jan-2005 | 101.5% | 100.9% | 102.8% |
| Feb-2005 | 101.7% | 101.2% | 103.1% |
| Mar-2005 | 101.8% | 101.3% | 103.2% |
| Apr-2005 | 102.0% | 102.0% | 103.5% |
| May-2005 | 102.2% | 102.3% | 103.3% |
| Jun-2005 | 102.4% | 102.1% | 103.2% |
| Jul-2005 | 102.6% | 102.6% | 103.5% |
| Aug-2005 | 102.8% | 102.7% | 103.6% |
| Sep-2005 | 102.8% | 102.9% | 103.9% |
| Oct-2005 | 102.9% | 103.0% | 103.7% |
| Nov-2005 | 103.2% | 103.1% | 103.8% |
| Dec-2005 | 103.3% | 103.2% | 104.0% |
| Jan-2006 | 103.5% | 103.6% | 104.0% |
| Feb-2006 | 103.7% | 103.7% | 104.1% |
| Mar-2006 | 104.0% | 103.9% | 104.2% |
| Apr-2006 | 104.1% | 103.7% | 104.4% |
| May-2006 | 104.1% | 103.4% | 104.2% |
| Jun-2006 | 104.2% | 103.7% | 104.5% |
| Jul-2006 | 104.3% | 103.6% | 104.4% |
| Aug-2006 | 104.5% | 103.6% | 104.4% |
| Sep-2006 | 104.6% | 103.6% | 104.5% |
| Oct-2006 | 104.6% | 103.4% | 104.4% |
| Nov-2006 | 104.7% | 103.5% | 104.5% |
| Dec-2006 | 104.9% | 103.8% | 104.6% |
| Jan-2007 | 105.1% | 104.0% | 104.7% |
| Feb-2007 | 105.1% | 104.1% | 104.7% |
| Mar-2007 | 105.3% | 104.2% | 104.8% |
| Apr-2007 | 105.3% | 104.1% | 104.8% |
| May-2007 | 105.4% | 104.0% | 105.0% |
| Jun-2007 | 105.5% | 104.2% | 105.4% |
| Jul-2007 | 105.5% | 104.2% | 105.1% |
| Aug-2007 | 105.5% | 104.1% | 105.1% |
| Sep-2007 | 105.5% | 104.0% | 105.1% |
| Oct-2007 | 105.6% | 104.0% | 104.8% |
| Nov-2007 | 105.7% | 104.1% | 104.8% |
| Dec-2007 | 105.8% | 104.1% | 105.0% |
| Jan-2008 | 105.8% | 104.3% | 105.2% |
| Feb-2008 | 105.7% | 104.5% | 105.2% |
| Mar-2008 | 105.7% | 104.4% | 105.0% |
| Apr-2008 | 105.5% | 104.1% | 104.9% |
| May-2008 | 105.3% | 104.1% | 105.0% |
| Jun-2008 | 105.2% | 104.0% | 104.9% |
| Jul-2008 | 105.1% | 103.9% | 104.8% |
| Aug-2008 | 104.9% | 103.8% | 104.6% |
| Sep-2008 | 104.5% | 103.6% | 104.7% |
| Oct-2008 | 104.1% | 103.4% | 104.3% |
| Nov-2008 | 103.6% | 103.0% | 104.0% |
| Dec-2008 | 103.0% | 102.5% | 103.4% |
| Jan-2009 | 102.4% | 101.8% | 102.5% |
| Feb-2009 | 101.9% | 101.2% | 101.9% |
| Mar-2009 | 101.3% | 100.6% | 101.1% |
| Apr-2009 | 100.7% | 100.0% | 100.3% |
| May-2009 | 100.5% | 100.0% | 100.3% |
| Jun-2009 | 100.1% | 99.4% | 99.8% |
| Jul-2009 | 99.8% | 99.3% | 99.4% |
| Aug-2009 | 99.7% | 99.0% | 99.1% |
| Sep-2009 | 99.5% | 98.4% | 99.1% |
| Oct-2009 | 99.4% | 98.8% | 99.1% |
| Nov-2009 | 99.4% | 98.8% | 98.9% |
| Dec-2009 | 99.2% | 98.9% | 98.9% |
| Jan-2010 | 99.2% | 98.7% | 98.9% |
| Feb-2010 | 99.1% | 98.6% | 98.9% |
| Mar-2010 | 99.3% | 98.7% | 99.0% |
| Apr-2010 | 99.4% | 99.0% | 99.4% |
| May-2010 | 99.8% | 99.2% | 99.5% |
| Jun-2010 | 99.7% | 99.2% | 99.4% |
| Jul-2010 | 99.7% | 99.1% | 99.5% |
| Aug-2010 | 99.7% | 99.3% | 99.6% |
| Sep-2010 | 99.6% | 98.9% | 99.6% |
| Oct-2010 | 99.8% | 99.6% | 99.9% |
| Nov-2010 | 99.9% | 99.7% | 99.9% |
| Dec-2010 | 100.0% | 99.7% | 99.9% |
| Jan-2011 | 100.0% | 100.0% | 100.0% |
| Feb-2011 | 100.1% | 100.1% | 100.1% |
| Mar-2011 | 100.3% | 100.3% | 100.2% |
| Apr-2011 | 100.6% | 100.5% | 100.3% |
| May-2011 | 100.6% | 100.8% | 100.3% |
| Jun-2011 | 100.8% | 100.8% | 100.2% |
| Jul-2011 | 100.9% | 100.2% | 100.7% |
| Aug-2011 | 101.0% | 101.1% | 100.6% |
| Sep-2011 | 101.1% | 101.6% | 100.7% |
| Oct-2011 | 101.3% | 101.4% | 100.5% |
| Nov-2011 | 101.4% | 101.5% | 100.5% |
| Dec-2011 | 101.6% | 101.6% | 100.8% |
| Jan-2012 | 101.8% | 101.7% | 100.6% |
| Feb-2012 | 102.0% | 101.8% | 100.8% |
| Mar-2012 | 102.2% | 102.2% | 101.4% |
| Apr-2012 | 102.3% | 102.5% | 101.7% |
| May-2012 | 102.4% | 102.1% | 101.6% |
| Jun-2012 | 102.4% | 102.3% | 101.6% |
| Jul-2012 | 102.5% | 102.0% | 101.2% |
| Aug-2012 | 102.7% | 102.4% | 101.4% |
| Sep-2012 | 102.8% | 103.0% | 101.6% |
| Oct-2012 | 102.9% | 103.0% | 101.8% |
| Nov-2012 | 103.0% | 103.2% | 102.1% |
| Dec-2012 | 103.2% | 103.3% | 101.9% |
| Jan-2013 | 103.4% | 103.7% | 101.6% |
| Feb-2013 | 103.6% | 104.0% | 102.2% |
| Mar-2013 | 103.7% | 104.1% | 102.3% |
| Apr-2013 | 103.8% | 103.4% | 101.9% |
| May-2013 | 104.0% | 104.0% | 102.3% |
| Jun-2013 | 104.1% | 104.2% | 102.5% |
| Jul-2013 | 104.2% | 103.7% | 102.5% |
| Aug-2013 | 104.4% | 104.2% | 102.7% |
| Sep-2013 | 104.6% | 104.7% | 102.9% |
| Oct-2013 | 104.7% | 104.8% | 103.0% |
| Nov-2013 | 104.9% | 104.9% | 103.0% |
| Dec-2013 | 105.0% | 105.0% | 103.1% |
| Jan-2014 | 105.1% | 104.9% | 103.3% |
| Feb-2014 | 105.2% | 105.0% | 103.3% |
| Mar-2014 | 105.4% | 105.0% | 103.4% |
| Apr-2014 | 105.7% | 105.0% | 103.6% |
| May-2014 | 105.9% | 105.6% | 103.8% |
| Jun-2014 | 106.1% | 105.8% | 104.0% |
| Jul-2014 | 106.3% | 105.9% | 104.1% |
| Aug-2014 | 106.4% | 106.0% | 104.5% |
| Sep-2014 | 106.6% | 105.9% | 104.5% |
| Oct-2014 | 106.8% | 106.1% | 104.5% |
| Nov-2014 | 107.1% | 106.3% | 104.9% |
| Dec-2014 | 107.3% | 106.4% | 104.8% |
| Jan-2015 | 107.4% | 106.4% | 104.9% |
| Feb-2015 | 107.6% | 106.6% | 105.0% |
| Mar-2015 | 107.7% | 106.7% | 105.1% |
| Apr-2015 | 107.9% | 106.9% | 105.2% |
| May-2015 | 108.2% | 107.3% | 105.4% |
| Jun-2015 | 108.3% | 107.4% | 105.5% |
| Jul-2015 | 108.5% | 107.6% | 105.7% |
| Aug-2015 | 108.6% | 107.5% | 105.7% |
| Sep-2015 | 108.7% | 107.4% | 105.8% |
| Oct-2015 | 109.0% | 107.8% | 105.9% |
| Nov-2015 | 109.2% | 108.0% | 105.9% |
| Dec-2015 | 109.3% | 108.0% | 106.2% |
| Jan-2016 | 109.4% | 108.1% | 106.5% |
| Feb-2016 | 109.6% | 108.3% | 106.6% |
| Mar-2016 | 109.8% | 108.3% | 106.6% |
| Apr-2016 | 109.9% | 108.5% | 106.8% |
| May-2016 | 109.9% | 108.5% | 106.6% |
| Jun-2016 | 110.2% | 108.2% | 106.5% |
| Jul-2016 | 110.4% | 109.0% | 106.9% |
| Aug-2016 | 110.5% | 109.2% | 107.1% |
| Sep-2016 | 110.7% | 109.2% | 107.0% |
| Oct-2016 | 110.9% | 109.1% | 106.9% |
| Nov-2016 | 111.0% | 109.3% | 107.2% |
| Dec-2016 | 111.1% | 109.2% | 107.0% |
| Jan-2017 | 111.3% | 109.9% | 107.3% |
| Feb-2017 | 111.5% | 110.0% | 107.4% |
| Mar-2017 | 111.5% | 110.2% | 107.4% |
| Apr-2017 | 111.7% | 109.9% | 107.4% |
| May-2017 | 111.8% | 110.0% | 107.4% |
| Jun-2017 | 112.0% | 110.1% | 107.5% |
| Jul-2017 | 112.1% | 110.3% | 107.5% |
| Aug-2017 | 112.3% | 110.2% | 107.4% |
| Sep-2017 | 112.3% | 110.3% | 107.4% |
| Oct-2017 | 112.5% | 110.6% | 107.5% |
| Nov-2017 | 112.7% | 110.6% | 107.5% |
| Dec-2017 | 112.8% | 110.7% | 107.8% |
Source: EPI analysis of Current Employment Statistics data from the Bureau of Labor Statistics
Figure A shows the number of jobs in Wisconsin, Minnesota, and the United States from November 2001 to December 2017, relative to the number of jobs in each geography in January 2011, the month that Governors Walker and Dayton took office. As you can see from the figure, changes in the level of jobs throughout the business cycle leading up to the Great Recession were remarkably similar between the two states. Both Minnesota and Wisconsin had modest job losses in the beginning of the period in the wake of the early 2000s recession, followed by modest job growth that tracked the U.S. average for a while and then flattened out for roughly the last two years prior to the onset of the Great Recession. In that earlier business cycle from November 2001 to December 2007, cumulative job growth was 3.7 percent in Minnesota and 3.3 percent in Wisconsin. Subsequently, the two states suffered losses in the recession that were similar, albeit slightly more severe in Wisconsin—with losses of 4.3 percent and 4.9 percent in Minnesota and Wisconsin, respectively, from December 2007 to December 2010.
The period from January 2011 to December 2017, after Governors Walker and Dayton assumed office, shows a starkly different picture. From early on in the recovery, Minnesota’s job growth accelerated noticeably more quickly than Wisconsin’s and the gap between the two states has increased fairly steadily ever since.
The Workplace Democracy Act restores workers’ bargaining power
Last Friday’s jobs report showed that the unemployment rate fell to 3.9 percent, the first time is has dipped below 4.0 percent since 2000. While many factors contribute to the overall unemployment rate—including labor force participation rates—policymakers should take note that a tightening labor market is not resulting in higher wages for working people. Nominal wage growth continues to fall short, rising only 2.6 percent over the year. One significant reason workers have been unable to insist on an increase in their paychecks is the uniquely low bargaining clout of U.S. workers.
While 60 percent of adults have a favorable view of labor unions, the most recent data available on union membership shows that, as of 2017, only 10.7 percent of wage and salary workers were union members. This disconnect is the result of decades of fierce opposition to unions and collective bargaining. These efforts have led to the enactment of state laws weakening—and even repealing—collective bargaining rights. At the federal level, corporate lobbyists have blocked attempts to reform outdated labor laws, enabling employers to exploit loopholes in the law and defeat workers’ organizing efforts. It is now standard practice for private employers to hire union avoidance consultants to quash workers’ efforts to unionize. Nearly ten years ago, a study found that roughly one-third of private sector employers fire workers during an organizing effort and over half of employers threaten to close the worksite if workers unionize. It is likely that employer opposition has intensified over the last decade, leaving more workers vulnerable to unlawful retaliation for exercising rights promised them over 80 years ago.
The Workplace Democracy Act, introduced today by Senator Bernie Sanders and several Democratic cosponsors, would begin to restore workers’ right to join together to improve their wages and working conditions. The legislation includes many critical reforms including closing loopholes in the law that enable employers to misclassify workers, denying them the right to organize. The bill also ensures that employers cannot subcontract their way out collective bargaining. And, the legislation ensures that working people have meaningful leverage in the workplace. These reforms would give U.S. workers more bargaining clout which is necessary to ensure a just economy.
The Supreme Court is poised to make forced arbitration nearly inescapable
The Supreme Court will soon decide whether employers can lawfully require workers to sign mandatory arbitration agreements that include class and collective action waivers. A ruling in NLRB v. Murphy Oil USA, Inc., Epic Systems Corp. v. Lewis, and Ernst & Young LLP v. Morris will have significant impacts on working people. If the Court sides with employers and the Trump administration, it is likely that the majority of workers in this country will be required, as a condition of employment, to sign away their right to pursue workplace disputes on a collective or class basis. In fact, available data suggest that it may take only six years for more than 80 percent of workplaces to adopt mandatory arbitration with class and collective action waivers.
Last year, EPI commissioned a survey that found that 53.9 percent of nonunion private-sector employers already have mandatory arbitration procedures. Prior to that study, the one major governmental effort to investigate the extent of mandatory arbitration was a 1995 GAO survey. That survey, conducted between April 1994 and April 1995, found that just 7.6 percent of employers had mandatory arbitration agreements. In other words, the use of mandatory arbitration agreements grew by more than 600 percent between 1994 and 2017. Using the growth rates between the two surveys to forecast future expansion suggests that by 2024, more than 80 percent of private sector, non-union establishments will adopt mandatory arbitration with class and collective action waiver of employment disputes, if the Court finds that such agreements are lawful.1 That will leave more than 85 million workers subject to mandatory arbitration agreements with class and collective action waivers. This means that the vast majority of workers will be forced to sign away their right to act with their colleagues to resolve workplace disputes—as well as their right to go to court for these matters. As a result, even if many workers face the same type of issue at work, each individual worker will be forced to hire their own lawyer, and resolve their dispute out of court, behind closed doors, with only their employer and a private arbitrator.
What to Watch on Jobs Day: Stronger wage growth as labor market slack continues to decline
While payroll employment growth was particularly weak in March, over the longer-term employment growth has been more than enough to keep up with growth in the working age population and even pull additional people off the sidelines and into the labor market. Labor force participation still has a way to go to reach full employment levels, but the trend continues to move in the right direction. And, make no mistake, we’ve never thought these displaced workers would be sitting on the sidelines forever. In fact, we’ve been expecting the workers to return to the labor force for years.
As those sidelined workers start dwindling in numbers, we should expect stronger and stronger wage growth. Continued slow wage growth tells us that employers still hold most of the cards, and don’t have to offer higher wages to attract workers. In other words, workers have very little leverage to bid up their wages. Therefore, wage growth remains one of the most important indicators to watch in Friday’s jobs report. The fact that nominal wage growth is still below target levels is a clear sign that the economy has yet to clearly reach full employment.
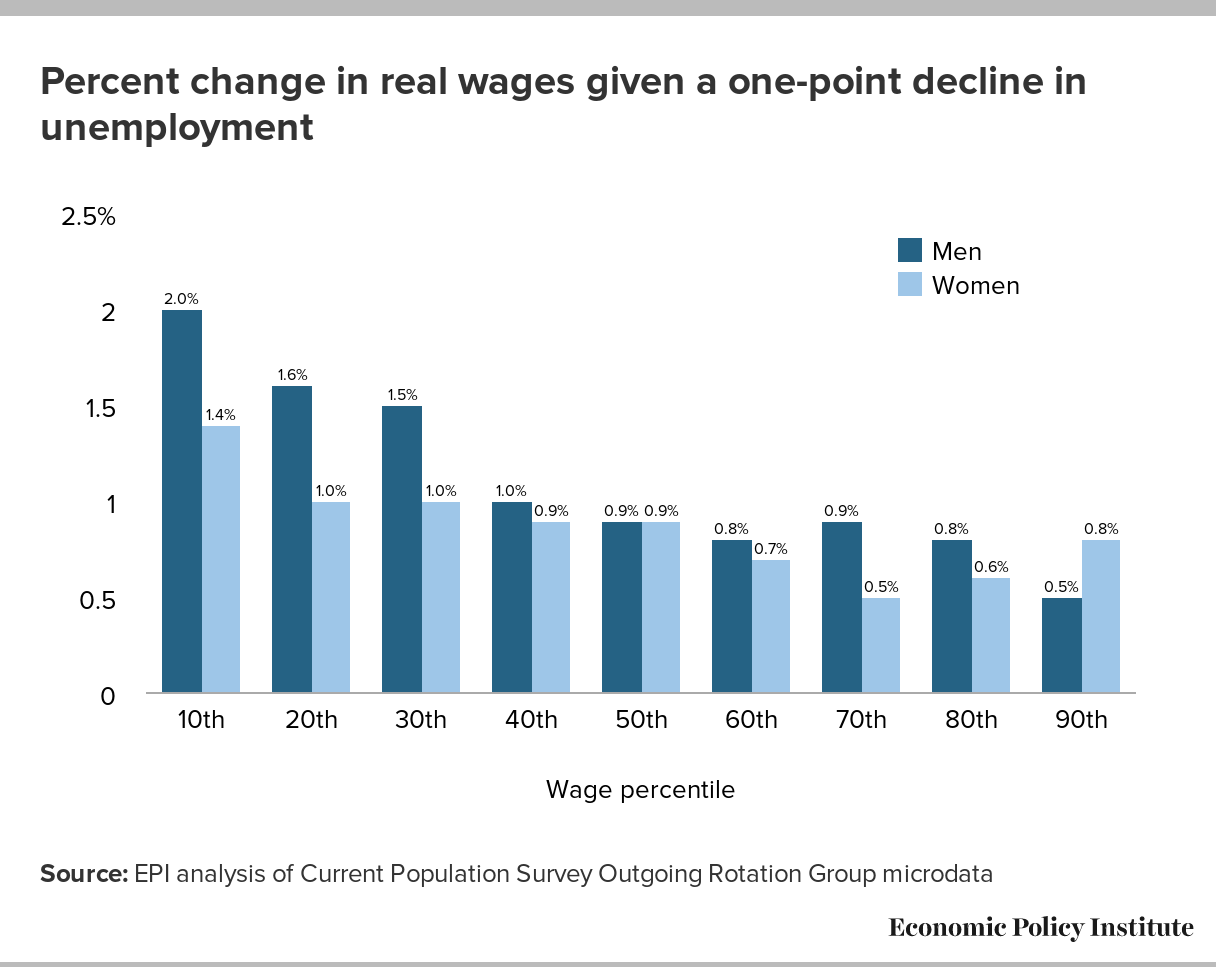
Alas, nominal wage growth for private-sector workers and even nominal wage growth for production/nonsupervisory workers offers only a limited view on wage growth in the economy today. One of the major benefits of a full employment economy is that wage growth isn’t simply strong for workers at the top of the wage distribution or for workers with more educational attainment. Younger workers, black workers, workers with lower levels of educational attainment, and workers at the middle and bottom of the wage distribution are disproportionately boosted in a stronger economy just as they are disproportionately harmed in a weaker one. Research has shown that for each percentage point decline in the unemployment rate, there is stronger wage growth in the lower part of the wage distribution than in the higher part (in particular, see Figure F here). Similarly, black workers saw disproportionately stronger opportunities for employment and wage growth in the latter part of the 1990s recovery than white workers did. Workers whose prospects fall farther in recessions see these prospects grow faster when times are good.
Let’s fight for working people on Workers’ Memorial Day
April 28 is Workers’ Memorial Day, an international remembrance day set aside to “mourn for the dead, and fight like hell for the living,” in the words of the immortal labor organizer Mother Jones.
In 2016, nearly 5,200 workers were killed on the job in the United States—14 workers every day—the highest number of workplace deaths in years. But that is only a part of the deadly toll: each year, more than 50,000 workers die from work-related disease. With this awful trend, any rational government would be proposing a significant increase in the budgets of our worker protection agencies and a rapid expansion of regulatory protections for workers.
Unless you’re just waking up from a 15-month nap, you know that workers’ rights—and especially worker safety and health—are under attack by the Trump administration like never before. And not only are workers under attack in their workplaces, but thanks to actions by the Environmental Protection Agency (EPA), the Interior Department, the Department of Agriculture and others, they’re also under attack where they live, where they eat, and where they vacation.
But these attacks didn’t originate in the fevered dreams of Donald Trump. What we’re seeing is the attempted wholesale implementation of the long-standing wish list of the conservative anti-worker Republicans, the Chamber of Commerce, and its anti-worker corporate allies.
And the attacks are not just aimed at the Occupational Safety and Health Administration (OSHA), but at a variety of other agencies— and even the scientific process underlying the ability of government agencies to legally protect workers from getting injured, killed, or sickened in the workplace.
It would take a long time to detail every attack on worker safety and the safety of the communities they live in, but I’ll list just a few here:
One of Donald Trump’s first actions as president was to issue an executive order requiring agencies to repeal two protections for every new one issued.
Eliminating the forced transfer of technology and production to China is critical
Late last month, the Office of the United States Trade Representative (USTR) issued its “Findings on the Investigation Into China’s Acts, Policies, and Practices Related to Technology Transfers, Intellectual Property, and Innovation Under Section 301 of the Trade Act of 1974”. The report re-confirmed previous findings concerning China’s reliance on forced transfer of technology and production from U.S. aerospace companies in return for market access. Just this week, USTR released its list of proposed tariffs on Chinese products.
While the findings of the report and the proposed tariff list represent steps forward in addressing this critical matter, findings and proposed lists alone won’t stop China from engaging in this unfair trade practice. The Trump administration should move quickly to implement a comprehensive strategy which includes:
- Placing tariffs on Chinese aerospace parts, components, and subassemblies that cost U.S. jobs;
- Filing a complaint (preferably joined by the European Union) at the World Trade Organization (WTO) against China’s unfair trade practices regarding forced transfers and subsidies to its aerospace industry; and,
- Making the elimination of forced transfers of technology and production a priority in bilateral and multilateral dialogues, including discussions over the U.S.-EU Transatlantic Trade and Investment Partnership (T-TIP).
Transfers of production and technology from U.S. aerospace and related companies are a serious matter. Among other things, they cost U.S. aerospace jobs and lead to a further decline in our aerospace industrial base in at least four different but related ways: First, jobs that may be associated with the transfer of technology and production are lost; second, the skills that accompany the transfers are lost leading to a further decline in our industrial base; third, future jobs are lost as China (and other countries) utilizes the transfer from the United States to create and strengthen their own aerospace companies that compete directly with U.S. companies; and fourth, the technology and production that would have led to more U.S. jobs through the development of innovative products is lost.
While China continues to utilize every tool available to establish a strong aerospace industry, up until now, the United States has done little to stop China from forcing the transfer of technology and manufacturing to develop its own industry. Far from implementing any strategic policy to stem this transfer, the U.S. government has largely left it up to U.S. aerospace companies to either comply with China’s forced transfer demands, or be shut out of China’s market. While the precise details of these transactions are not public, numerous reports shed light on how China plays the world’s two large commercial aircraft producers, Boeing and Airbus, against one another.
Social Security is looking like a pretty good investment these days
In 2005, President George W. Bush attempted to partially privatize Social Security. He centered his argument for this change on the claim that people would fare better investing in asset markets than contributing to Social Security. The privatization push proved highly unpopular, as research from EPI and others highlighted the high transition costs and investment risks.
Nevertheless, the belief that Social Security amounts to a low-risk but low-return investment persists, hampering proposals to expand the popular program. This is unfortunate, as Social Security looks better than ever in comparison to low-performing 401(k)s and IRAs.
As shown below, a young worker today with average career earnings will receive Social Security retirement benefits equivalent to total employer and employee retirement contributions plus a 5.7 percent annual rate of return. This “internal rate of return” is not much lower than the 7.0 percent net return for 401(k)-style defined contribution plans between 1990 and 2012, and it’s higher than more recent returns for these plans and IRAs (3.1 percent and 2.2 percent, respectively, over the 2000–2012 period).
Social Security internal rate of return, medium earner aged 21 in 2018 with average life expectancy at retirement (retirement benefits only)
| Medium Earner | |
|---|---|
| Based on Current Contribution Rate | 5.7% |
| Based on Contribution Rate after Eliminating Shortfall | 5.0% |
| Based on Full Cost Rate | 4.5% |
Source: Author's calculations based on inflation, average wage, and cohort life expectancy projections in single-year tables underlying the 2017 Social Security Trustees Report; and the "medium earner" in Michael Clingman and Kyle Burkhalter, "Scaled Factors for Hypothetical Earnings Examples Under the 2017 Trustees Report Assumptions," Social Security Administration Actuarial Note, July 2017. Assumes retirement at normal retirement age (67).
This calculation doesn’t take Social Security’s projected long-term shortfall into account. But even if we closed the shortfall by raising the contribution rate from 10.0 percent to 12.6 percent (excluding contributions going toward disability benefits), the internal rate of return for a medium earner would be 5.0 percent.
Though Social Security is primarily funded through worker contributions, a small share of the cost is paid for by taxes on the benefits of better-off retirees that revert to the program. If these taxes on high earners were eliminated so that the entire cost of retirement benefits were funded by worker contributions, the internal rate of return for a medium earner would be a healthy 4.5 percent, still an excellent return for such a low-risk investment.
Rates of return on 401(k)-style plans vary widely and are subject to market downturns. To reduce the risk of worse outcomes, most investors, especially retirement savers, would choose a secure 5 percent return over a volatile return averaging 7 percent, since, contrary to popular belief, investment risk doesn’t disappear over long time horizons.
The SEC’s “Regulation Best Interest” is in the best interest of Wall Street, not retirement savers and other investors
On Wednesday, the Securities and Exchange Commission (SEC) issued over 1,000 pages of proposed regulations relating to the conduct of financial professionals. Among other things, the proposals specify that brokers must act in the best interest of clients, limit the use of terms like “financial adviser,” and require financial professionals to provide clients with short descriptions of their legal obligations to the client and of their compensation structure.
At first blush, these appear to be positive, albeit incremental, steps. In fact, their purpose is not to protect investors, but to present an alternative to the much stronger protections in a Department of Labor (DOL) rule that requires financial professional offering investment advice to retirement savers to adhere to a fiduciary standard. While the DOL rule remains in place for the time being, the Trump administration has delayed its full implementation and enforcement, and it has been challenged in court by financial industry players. EPI has estimated that these delays will cost investors $18.5 billion in higher fees and lower net returns over the next 30 years.
The SEC’s proposed “best interest” standard, which to unsuspecting investors may sound similar to the DOL’s fiduciary standard, is in fact much weaker. Though it would prohibit brokers and other financial professionals from steering clients toward clearly unsuitable investments, financial professionals are already prohibited from doing so under current rules. While these rules prevent brokers from—say—recommending highly risky investments to risk-averse clients, they don’t prevent them from promoting higher-cost but “suitable” investments when similar lower-cost investments are available.
The SEC proposals, unlike the DOL rule, do not prohibit commissions and other forms of compensation that create conflicts of interest between financial professionals offering advice and their clients. Though some egregious practices may be curbed, the practical impact of the SEC proposals is unclear because the Commission does not define “best interest.” If anything, dissenting Commissioner Kara Stein says the proposed regulations appear designed to provide financial professionals with guidelines on how to adhere to the letter of the law with written disclosures, policies, and procedures—but no meaningful changes to actual practices. Moreover, enforcement is likely to be weak, because investors would not be able to sue brokers for violating the “best interest” standard, but would only have recourse to private arbitration under the auspices of the Financial Industry Regulatory Authority (FINRA), an industry-funded body. As Commissioner Stein put it, a better name for these proposals is “Regulation Status Quo.”
Teacher unions and students’ long-term economic prospects
A recent academic paper by economists Michael Lovenheim and Alexander Willén argues that men who lived as school-age children in states where teachers were allowed to bargain collectively are less likely to work as adults and, when they do work, they earn significantly less than men who grew up in states where teachers were not allowed to bargain collectively.
There are at least three reasons to be deeply skeptical of their findings.
First, the chain of causal links is extremely circuitous. The reasoning runs from a student’s initial potential “exposure” to teachers’ right to collective bargaining all the way through to the conclusion that this “exposure” significantly worsened labor market outcomes decades later as an adult. In most of their analysis, the authors rely on data that let them know the state where a person was born and the employment situation of that same person in a single year between the ages of 35 and 49. The researchers use this information to construct a simulated educational history for each adult, where they assume that the person attended K-12 school in the state where they were born. The researchers, however, don’t actually know that an individual lived in the state of birth while at school age, or whether the school the individual attended was unionized, or even whether the individual attended a public or private school. Instead, the paper’s conclusions hinge on the idea that students born in states with collective bargaining for teachers were more likely to be “treated” by collective bargaining than students in “control” states where teacher collective bargaining was not permitted. This is possible, of course, but the methodology leaves substantial room for other factors that might explain the observed differences in labor market outcomes of adults who were born in different states. The states that denied teachers the right to bargain collectively, for example, include 11 southern states, which have many long-term trends in common other than collective bargaining rights, including industry and age structure, income distribution, climate, and rapid population growth.
The Trump administration doubles down in the Wall Street Journal on why trickle-down really does work
Kevin Hassett, the chair of the Trump administration’s Council of Economic Advisers (CEA), wrote an op-ed in the Wall Street Journal this week mounting a defense of the Tax Cuts and Jobs Act (TCJA)—the tax cut passed by congressional Republicans and signed into law by the president at the end of last year. It starts out badly, railing against “leftists from Marx to Piketty (?!)” and doesn’t get much better from there.
It is an objective fact that the cut’s direct benefits are extraordinarily regressive, with 83 percent of these benefits going to the top 1 percent of households when it’s fully phased-in. Most of this regressivity is due to the very large cut in corporate taxes enacted as part of the TCJA. Ownership of corporations, and capital assets generally, is extremely concentrated in richer households, so, the direct effect of cutting taxes on capital is to funnel money to the top.
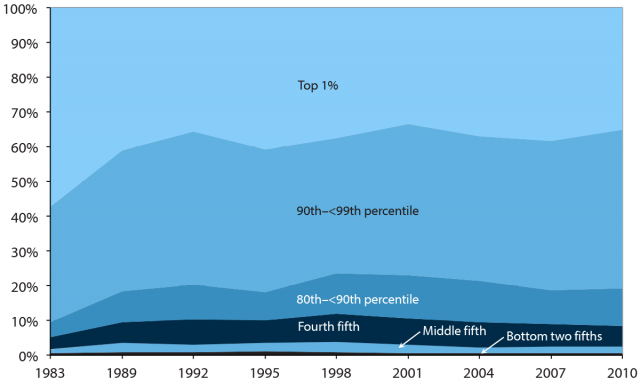
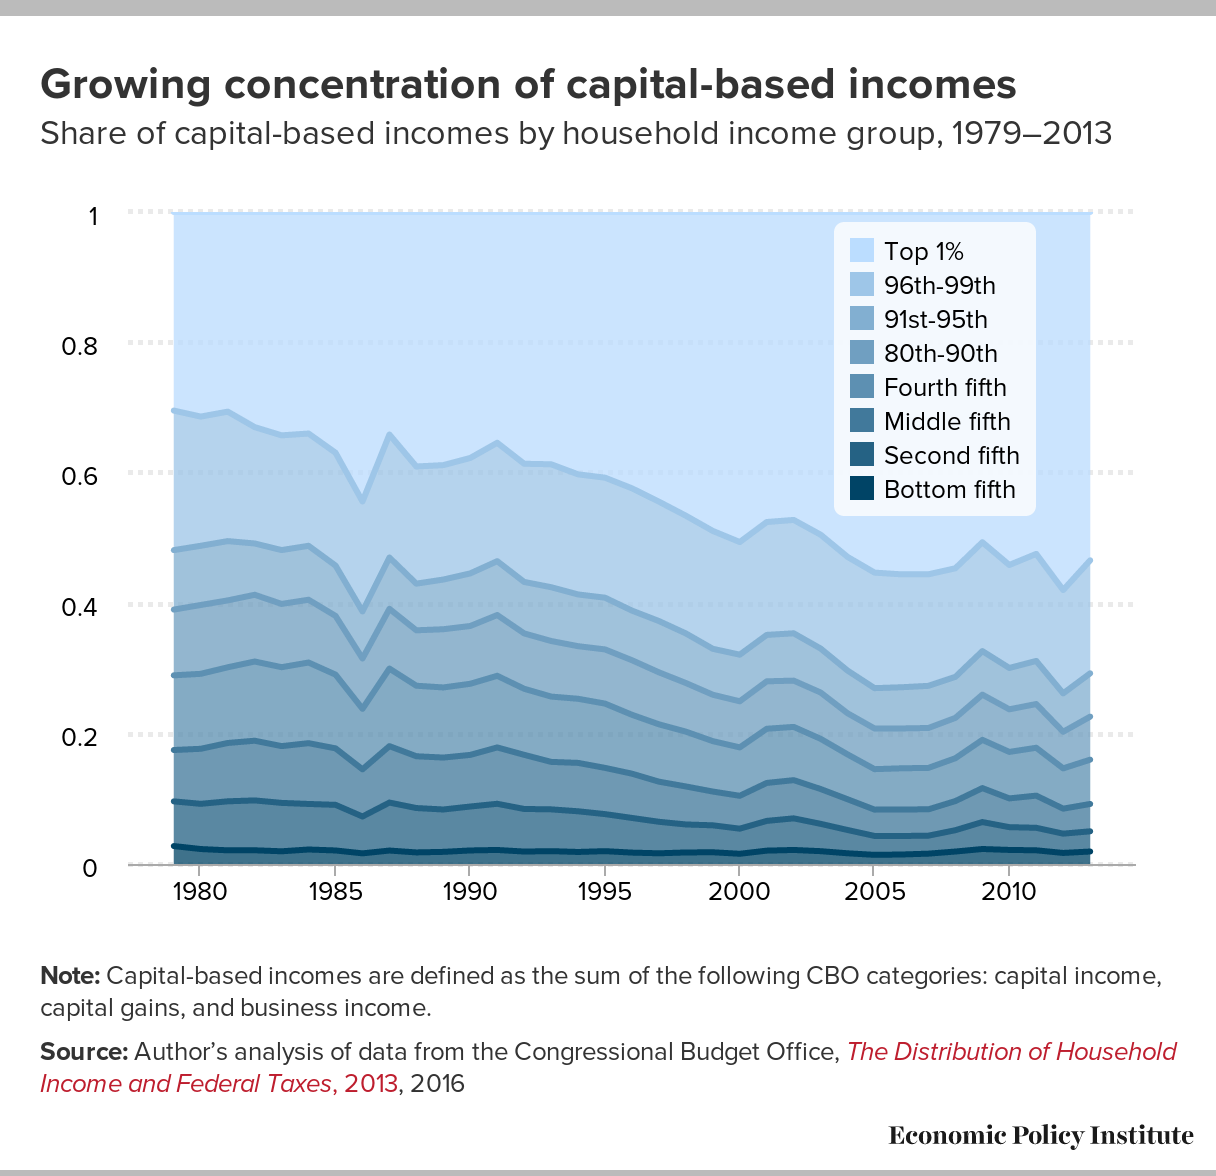
But Hasset insists indirect effects will trickle down to benefit the rest of us. His operating theory is almost quaint in how antiquated it is: “…workers do well when their employers do.” This leads him to claim that “when profits go up, capital investment goes up, and wages follow.”
For Tax Day, a reminder that economic arguments for the GOP tax plan have no theoretical basis
On Tax Day, Republicans in Congress will surely be trying to tout the benefits from the Tax Cuts and Jobs Act (TCJA) that they passed in December. It’s still far too early to make big claims about what the data shows about the effect of the TCJA, but it’s worth remembering why we should be very doubtful that any benefits at all will accrue to typical American families from the largest— and only permanent—feature of the TCJA, the cuts in corporate income tax rates.
The TCJA’s likely effect on the economy depends on whether the economy remains demand-constrained or not. Below, we’ll lay out why the TCJA is bad policy regardless of whether or not today’s economy remains demand-constrained.
When the economy is demand-constrained, there is not enough overall spending in the economy—or “aggregate demand”—to pin the economy at full employment. If the economy still suffers from a lack of aggregate demand, as we believe is likely the case, then tax cuts can boost demand—and thereby employment—by increasing the post-tax income of households and businesses.
The TCJA is generally not defended on the grounds that it will boost demand. The reason why is clear: the tax cuts that make up the bulk of the TCJA—tax cuts for the rich and big corporations—are by far the weakest fiscal stimulus to aggregate demand. High-income households are more likely to save the money they receive from a tax cut than low- and moderate-income households. This means that much of the TCJA will end up as savings in the pockets of rich households rather than a boost to aggregate demand. Corporate tax cuts don’t rate any better on this core, for the same reasons. In the short run, the benefits of corporate tax cuts flow to shareholders. The top 1 percent owns 40 percent of total stocks. In short, corporate rate cuts are simply tax cuts for the rich by another name. Tax cuts for low- and middle-income households would have provided about three times as much bang for the buck as the TCJAs tax cuts for the rich and big corporations, as would have increases to income support programs or infrastructure spending.
All of this is why defense of the TCJA (and tax cuts for rich people generally) assume the economy is not demand-constrained and is already at full employment. In this case, the claim is that cuts to the corporate rate give companies higher after-tax profits with which they can pay dividends to shareholders. This increases corporations’ incentive to undertake investment in new plant and equipment. And because the increase in the post-tax return to capital owners’ savings induces households to save more (or attracts more savings from abroad), these desired new investments can be financed without being choked off by rising interest rates. The resulting increase in capital investment gives workers more and better tools to work with, which boosts labor productivity and eventually wages.