The coronavirus economic policy response must include relief and redistribution now and major demand stimulus once the crisis passes
Key takeaways
Sen. Mitch McConnell’s bill would make the U.S. economic response as far behind as the public health response, relative to international best practice.
An economic relief package must include:
- Maximization of the income that can be delivered through existing social insurance and safety net programs during the lockdown and its aftermath
- Substantial aid to state and local governments
- Bailouts of industries’ workers, not shareholders, creditors, or senior management
- Direct cash payments to households
- Conditions-based triggers that keep aid flowing
The U.S. economy will contract enormously in the coming months. Economic activity will fall more sharply than in perhaps any other period in modern history, and tens of millions of U.S. employees will be forced to stop working. Unlike previous economic shocks, we want this contraction to happen—it is a byproduct of the necessary public health response to the coronavirus.
But even as major parts of the economy shut down completely, people will need resources to live, resources they generally get by working. The United States is a rich enough country to provide these, even in the face of a prolonged economic shutdown. We even have obvious policy levers that can transfer huge amounts of resources to those out of work through no fault of their own: the existing social insurance and safety net programs that have been built exactly for this purpose—if not necessarily envisioned to work on this scale.
These existing social insurance and safety net programs can be supplemented with ad hoc emergency measures to support the vast majority of U.S. families through the social distancing measures of the epidemic. These same measures can also ensure that families emerge from the lockdown with finances largely intact. When the all-clear is sounded, a major fiscal stimulus to boost demand should be ready to rev up the economy as fast as possible. The quicker that firms feel pressure to supply goods and services to customers, the more likely they will be to reestablish the employment relationships they had with workers before the crisis hit, and the less economic scarring will occur.
Fixing unemployment insurance and the coronavirus response
The novel coronavirus has brought sudden attention to the unemployment insurance (UI) system and its ability to quickly deliver aid to families and stimulus to the economy. Economists estimate that we will lose nearly 14 million jobs by the summer even with a sizable stimulus package. Workers in industries heavily dependent on women and workers of color, like food service and retail, have borne the brunt of the pandemic. Policymakers must focus both on immediate changes to help these individuals, and structural fixes that can gird the nation for the challenges of a recession and future economic crises.
This fact sheet is a joint project of the Women’s Law Center, the National Employment Law Project, the Economic Policy Institute, the Century Foundation, and the Georgetown Law Center on Poverty and Inequality Economic Security and Opportunity Initiative. View the fact sheet
The UI System Is in Desperate Need of Repair
The basic UI program, operated by the states with federal oversight; the federal-state Extended Benefits (EB) program; and the Disaster Unemployment Assistance (DUA) program are facing this crisis at one of their weakest points in history.
- Access to UI Is Already Extremely Limited: The percentage of all jobless workers receiving a UI payment has dropped from 43.7 percent in 2001 to just 27.8 percent in 2018, with low-wage workers the least likely to receive benefits.
- UI Programs Have Been Inadequately Funded for Decades: During the last recession, 36 state unemployment trust funds went broke, and despite the longest economic expansion in U.S. history, 22 entered the COVID-19 crisis with insufficient savings. Without aid many trust funds will go broke again.
- UI Benefits Are Meager: The average benefit of $382 per week only represents 32.7 percent of the average wage.
- UI Administration Has Been Dramatically Under-Resourced: The federal grants for state operations have been cut by 30 percent since the 1980s, leaving states with threadbare staff and antiquated computer systems overwhelmed by COVID-19. The additional $1 billion appropriated by Congress won’t meet the need.
- Disaster Unemployment Assistance (DUA) is ill equipped to handle this or other crises given its low benefit amounts, unrealistic time limits, and limited coverage.
Ongoing Federal Reforms Represent a Timely Down Payment on Overdue Structural Change
The Families First Coronavirus Act and the stimulus package being negotiated go a long way toward addressing the challenges facing unemployed workers during this current crisis.
- The Families First Coronavirus Act delivered $1 billion in aid to states to process the spike in claims, and granted states more flexibility to approve unemployment claims due to the unique circumstances of the COVID-19, such as quarantines and stay-at-home orders. It also provided full federal funding of the federal EB program, which will trigger on when unemployment rises.
- The 3rd COVID-19 response package is reported to have $250 billion in temporary enhancements to unemployment assistance through 2020, including a $600 increase in the weekly checks of unemployed workers, a special disaster unemployment assistance program (Pandemic Unemployment Assistance) that covers the self employed, a temporary 13 week extension of benefits, federal funds to eliminate the waiting week and to support shared work programs.
Now Is the Time to Advance Structural Reforms
Unfortunately, the challenges ahead in the coming months of crisis and recovery will extend beyond the timeline for these shorter-term reforms, which alone are not enough to upgrade the UI system to fully respond to a crisis of this magnitude. Businesses large and small are already closing, and many workers will count on the UI program to weather the many months it will take to find new jobs in an economy slowly regaining its footing. Providing a strong, sustained structure of benefits now is a critical part of the architecture of mitigation and recovery.
In the coming weeks and months, Congress must:
- Fix automatic EB triggers: Turn on additional weeks of benefits automatically anytime the unemployment rate jumps a half percentage point, and add more weeks when it goes up to 6.5, 7.5, and 8.5 percent.
- Require states to enact shared-work programs that allow companies to avoid layoffs by putting workers on part-time schedules with partial unemployment benefits and provide federal funding for these programs during economic crises like now.
- Create minimum state standards around benefit length and generosity: Federal law should require all states provide a minimum of 26 weeks of benefits, reversing the actions of states that reduced the duration of benefits after the Great Recession. State UI programs should also replace at least 60 percent of a worker’s weekly wages, with a maximum of 67 percent of state’s average weekly wage.
- Create a jobseekers allowance of 13 weeks, at a lower benefit amount, for workers who are not covered by regular or pandemic unemployment insurance. This includes populations such as new entrants and students graduating into this recession, and returning caregivers, some of whom may need additional wrap-around services to support job search.
- Fill holes in the unemployment safety net: Increase recipiency of low-wage workers, who are disproportionately people of color and women, by requiring states to count the most recent earnings of UI applicants, treat part-time and full-time workers equally, and recognize unemployment caused by compelling personal issues such as illness, domestic violence, and relocation to follow a partner to a new job.
- Adequately fund unemployment benefits: Current federal law only requires states to tax $7,000 of each worker’s wage. This taxable wage base should be increased over five years to one-third of the Social Security wage base and indexed to gradually increase every year, to provide a stronger foundation for financing. Link any rescue funding for state trust funds to these long term fixes.
- Help UI claimants get back to work through the Wagner-Peyser Employment Services and periodic reemployment services.
Congress failed to fix these structural flaws in the wake of the Great Recession and the numerous state roll-backs of UI benefits and lingering insolvency that followed. The COVID-19 crisis should be a wake-up call to the need to immediately improve the basic structure of the nation’s first responder to economic distress.
Here are safeguards needed in bailout packages to protect working people and fight corporate greed
This week, Congress continues to negotiate a fiscal stimulus package to help ease the economic shock of the coronavirus. In these negotiations, it is critical that lawmakers establish strong conditions for industry bailouts. Working families, not just shareholders and corporate executives, must receive the benefits of any taxpayer-funded bailout.
Our economy is marked by extreme inequality. Chief executive officer (CEO) compensation has grown 940% since 1978, while typical worker compensation has risen only 12% during that time. From 1979 to 2018, the wages of the top 1% grew 158%, whereas the wages of the bottom 90% combined grew just 24%, less than one-sixth as fast. Extreme inequality and wage stagnation for virtually all but the highest earners for most of the last four decades have left fewer and fewer U.S. workers able to access the middle class. What Congress does now with this fiscal stimulus will either help address this inequality, or compound it and leave more workers behind.Read more
The unemployment rate is not the right measure to make economic policy decisions around the coronavirus-driven recession: Policymakers should use the employment rate to continue or stop economic assistance
Policymakers often use the unemployment rate to trigger when to turn on or turn off financial assistance in economic downturns and recoveries. The unemployment rate, however, is a bad choice for a policy trigger in the current pandemic-driven recession.
A large share of workers who lose their jobs in the coming weeks and months will very likely not be counted in the official unemployment rate because they won’t be actively looking for work. Given the nature of the pandemic, where we are all being told to stay away from work and all non-essential public activity, many laid-off workers will make the rational decision not to search for work until they get the all-clear from public health authorities.
Think of the restaurant worker who just got laid off. They might not report looking for work because that whole sector is shut down. What would be the point in actively looking for a job when it’s clear that there are none out there?
(In this video, Elise breaks down how to go about finding the right measures for economic policy decisions.)
Instead of using the unemployment rate as a trigger-off mechanism, policymakers should use the employment rate—the share of the adult population with a job.
The coronavirus fiscal response should be as big as needed—but current forecasts indicate at least $2.1 trillion is needed through 2020: The expected hit to the economy would mean almost 14 million job losses by summer
- The stimulus package to deal with the coronavirus economic shock should be as big as economic conditions dictate.
- The package to restore the nation’s economic health should spend at least $2.1 trillion through the end of 2020. This amount could increase even this year, and aid should continue past this year if conditions warrant.
- The fiscal response should continue until we reach full employment.
- The stimulus should be well-targeted and not squandered on unconditional giveaways to business that don’t spur the needed growth.
- The risk of going too small on stimulus is large and scary, while the risk of going too big is almost nonexistent.
Congress is taking up a fiscal stabilization package this week to cushion the economic shock of the coronavirus. A natural question arising in this debate will be “how big should it be?” The experience of the Great Recession argues clearly that the answer to this has to be “as big as is needed.” This is unsatisfying but is the most important answer to this question so we don’t repeat the fiscal policy blunders of the past.
For those who absolutely need a number to focus on, the likely cost of a fiscal boost sufficient to restore economic health by the end of 2020 starts at $2.1 trillion—but it could be more, and fiscal policy should be set to deliver more if conditions warrant. And conditions continue to worsen. The expected hit to the economy would mean a job loss of almost 14 million workers by summer.Read more
Every state will lose jobs as a result of the coronavirus: Policymakers must take action
Workers across the country have already lost their jobs as businesses temporarily shutter in response to the social distancing measures necessary to stop the spread of coronavirus—a trend which can be mitigated if policymakers act quickly. Expectations of just how many jobs will be lost are rapidly evolving. Goldman Sachs forecasts that the economy will contract by 2.5% over the first half of this year—which we estimate will translate into a loss of 3 million jobs by June. An even bleaker forecast from Deutsche Bank, which is in line with projections from JPMorgan, suggests that 7.5 million jobs will be lost by the summer. In this post, we attempt to predict the state-level impacts of these losses using the midpoint of these two forecasts—an estimated 5.25 million jobs lost.
We have distributed this projected job loss across states to provide a sense of the magnitude of the state-level shock, shown in Figure A. The coronavirus shock that is causing this recession is broad-based; the effects will likely be felt in every industry and geography. Still, workers in certain industries will be disproportionately affected—in particular, workers in food service, accommodations, and brick-and-mortar retail. As a result, states where these industries make up a larger share of employment, such as Florida, Hawaii, and Nevada, will be particularly hard hit. In Nevada, where two out of every five jobs are in leisure, hospitality, or retail, the state will likely lose 5.3% of private-sector jobs.Read more
Not everybody can work from home: Black and Hispanic workers are much less likely to be able to telework
The commonly paired statements that “everyone is working from home” and “everyone is having their goods delivered” amid the coronavirus outbreak ignores a whole segment of the workforce—the ones prepping and delivering their purchases. In fact, less than 30% of workers can work from home, and the ability to work from home differs enormously by race and ethnicity.
The chart below separates the share of workers who can telework for the three largest race groups as well as by Hispanic ethnicity (these groups are not mutually exclusive in these data). Asian workers are the most likely to be able to work from home, followed by non-Hispanic and white workers. Only 16.2% of Hispanic workers and 19.7% of black workers can telework.
Less than one in five black workers and roughly one in six Hispanic workers are able to work from home: Share of workers who can telework, by race and ethnicity, 2017--2018
| Race/ethnicity | Able to telework | |
|---|---|---|
| Race | White | 29.9% |
| Black or African American | 19.7% | |
| Asian | 37.0% | |
| Ethnicity | Hispanic or Latino | 16.2% |
| Non-Hispanic or Latino | 31.4% |
Source: U.S. Bureau of Labor Statistics, Job Flexibilities and Work Schedules — 2017–2018 Data from the American Time Use Survey
The next figure illustrates the share of workers who can telework by wage. Not surprisingly, low-wage workers have the least flexibility in their jobs: Only 9.2% of workers in the lowest quartile of the wage distribution can telework compared with 61.5% of workers in the highest quartile.
Higher-wage workers are six times as likely to be able to work from home as lower-wage workers: Share of workers who can telework, by wage level, 2017--2018
| Usual weekly earnings of full-time wage and salary workers(single jobholders only) | Share of workers who would work at home |
|---|---|
| Earnings greater than the 75th percentile | 61.50% |
| Earnings from 50th to 75th percentiles | 37.30% |
| Earnings from 25th to 50th percentiles | 20.10% |
| Earnings less than or equal to the 25th percentile | 9.20% |
Source: U.S. Bureau of Labor Statistics, Job Flexibilities and Work Schedules — 2017–2018 Data from the American Time Use Survey
What to expect in tomorrow’s unemployment insurance numbers: The leading edge of the coronavirus’s shock to the labor market, not the full picture
Tomorrow morning we will get the first piece of government labor market data that will show early signs of the coming coronavirus shock—initial unemployment insurance (UI) claims. When a worker is laid off and they apply for unemployment insurance, they show up in the Bureau of Labor Statistics’ initial unemployment insurance claims data, which means these data are a timely proxy for the number of workers who have been laid off. And reports of layoffs due to the coronavirus are beginning to stream in.
We estimate that by the summer, more than 3 million workers will have lost their jobs due to the coronavirus shock. How much of that will show up in the numbers released tomorrow? Definitely some, but perhaps not as much as you might expect. Tomorrow’s numbers capture unemployment insurance claims for the week ending last Saturday, March 14. While media reports suggest layoffs began accelerating last week, there is often a lag between when people are laid off and when they apply for benefits. If a worker was laid off last week and waited to apply for benefits until this week, they will not show up in tomorrow’s data. Further, while coronavirus layoffs began last week, the full weight of the impact—while swift—is still ramping up as businesses realize what they are up against.
This means that we should look at the numbers that come out tomorrow as just the leading edge of the labor market impact of the coronavirus shock. No one should take comfort if these numbers are relatively modest. In coming weeks, millions will likely be laid off, or not hired when they otherwise would have been. Policymakers should be thinking about a big fiscal stimulus package, including financing a sizeable amount of household consumption, giving fiscal aid to state governments, providing a payroll tax credit to businesses to not lay off workers, ramping up direct government purchases of things like medical equipment to help fight the virus, and making sure all measures to address the coronavirus economic shock are automatically continued until economic conditions warrant them being removed.
I will be analyzing the data when they are released tomorrow and down the road, as we have a fuller picture of how the coronavirus has impacted the labor market.
Update: Shierholz’s March 19 analysis of the unemployment data is available here.
Senate coronavirus bill is crucial—but it’s a fraction of what’s needed
Family First Coronavirus Response Act is an important first step in the United States’ response to the COVID-19 pandemic, and the Senate should pass it immediately. There are provisions for both health spending and paid sick leave, as well as income supports in the form of expanded food-assistance programs and unemployment insurance.
We summarize some of the bill’s specific provisions below, but we first want to highlight a few important loopholes and talk about the important next steps.
The bill has some glaring exclusions. Perhaps the most problematic is the carve-out for large businesses; the bill exempts employers with more than 500 workers from its paid leave mandate. Bureau of Labor Statistics data show that 11% of workers at private-sector businesses with 500 workers or more do not have access to paid sick leave, and 48% of private-sector workers work in firms with 500 workers or more. Together, that means that 6.8 million private-sector workers in large firms will not have paid sick days as a result of the large-firm exemption. And this does not count the fact that workers at these firms that do provide paid sick days often do not provide enough time for workers to self-quarantine for the recommended 14 days.
The bill also makes it possible for the Secretary of Labor to exempt certain health care providers and emergency responders from its paid leave provisions, and to exempt businesses with less than 50 people. The data show that 36% of workers at private-sector businesses with less than 50 workers do not have access to paid sick leave, and 27% of private-sector workers work in firms with 50 or fewer workers, together meaning that 12.8 million workers may not have access to paid sick days as a result of potential exemptions for small businesses. Read more
The coronavirus pandemic requires state and local policymakers to act, in addition to demanding a strong federal response
Federal lawmakers seem poised to enact legislation that would help combat some of the public health and economic dangers posed by the COVID-19 pandemic. However, this initial legislation is not sufficient to fully address the problems created by the crisis, and even with additional federal action, there are still steps that state and local policymakers must take—both to slow the spread of the virus and to mitigate the economic toll that the crisis will take on state and local economies. Here are some of the critical steps that state and local officials should consider, including many good ideas that are circulating and some of the positive steps already being taken:
Protect public health
- The foremost action for state policymakers and community leaders is to do everything they can to slow the spread of the virus. Though it will be disruptive in the short run, leaders need to strongly encourage social distancing. In many communities, this may require closing schools, libraries, and other community centers; cancelling events; requiring telework where possible; ordering retail shops, restaurants, and bars to close or shift to delivery service only; and setting strict limits on public gatherings.
- Expand access to testing and treatment by bolstering state and local health care systems with emergency funding and, to the extent possible, removing any financial barriers for people seeking care. Good examples can be seen in Washington, where Governor Inslee used his emergency powers to require state health care insurers to waive all copays and coinsurance for all coronavirus testing. Similar actions have been taken in California, Colorado, Massachusetts, New Jersey, and New York. But states should commit to not only covering the cost of coronavirus testing, but treatment as well. Federal lawmakers are considering a 6.2% increase in the share of Medicaid costs covered by the federal government to help relieve the strain on state budgets caused by the virus. Such an increase should hopefully be enough to cover the vast majority of COVID-19-related care.
- Expand health care coverage through Medicaid and the exchanges, and protect coverage for those with employer-based plans. As the Century Foundation discusses, states should request emergency waivers to quickly expand eligibility for Medicaid, especially in those states that did not adopt the Affordable Care Act (ACA) expansion. States that run their own health insurance exchanges can also declare the COVID-19 outbreak as a special enrollment period that allows people to sign up for coverage outside the standard open enrollment period. Governors should also use emergency authority to require employers to maintain insurance coverage for employees whose work hours fall below the ACA’s 30-hour threshold for employer provision of insurance.
- Enact emergency paid sick leave programs that cover all workers in businesses of all sizes in those states where such systems do not already exist. The federal COVID-19 response bill that is moving through Congress takes an important step in the right direction, but does not provide the comprehensive access to paid leave that this moment demands (and should really be available in non-pandemic times anyway). Giving workers the ability to take time off when they or a family member are sick protects public health. It eliminates the need to work when they’re ill or must provide care for a sick family member, thereby reducing the risk of disease transmission. Studies have shown that paid leave programs measurably reduce virus transmission. In states that have paid leave programs, lawmakers should mandate that businesses provide at least 14 days of leave, regardless of workers’ accrued leave time.
- Create clear, accessible systems for communicating information about the virus and resources for the public. This can include hotlines and online resource pages. It may also require larger public education efforts—public service announcements, social media campaigns—and resources to expand online access for low-income communities and make content available in multiple languages.
Coronavirus shock will likely claim 3 million jobs by summer: Policy is needed now to curb further losses
Note: Economic forecasts have been revised since this post was published. See this post for more recent job loss projections.
At this point, a coronavirus recession is inevitable. But the policy response can determine how deep it is, how long it lasts, and how rapidly the economy bounces back from it.
If this response includes enough fiscal stimulus that is well-targeted and sustained so long as the economy remains weak, job loss will be substantially reduced relative to any scenario where policymakers drag their feet. Even with moderate fiscal stimulus, we’re likely to see 3 million jobs lost by summertime. Keeping this number down and allowing any job loss to be quickly recouped after the crisis ends should spur policymakers to act.
Put simply, the federal government needs to finance a much larger part of household consumption in coming months, transfer significant fiscal aid to state governments, and ramp up direct government purchases (particularly on items helpful in fighting the epidemic).
COVID-19 pandemic makes clear that we need national paid sick leave legislation
The COVID-19 pandemic continues to highlight the costs of economic inequality in the United States. There’s the inequality in access to paid sick days and health insurance between high- and low-wage earners. There’s the inequality in the ability to work from home across sectors, with workers in one of the most exposed sectors—leisure and hospitality—being the least likely to have the ability to work from home. And there will be inequality in the economic impact of the pandemic, as workers in those sectors are at higher risk of reduced work hours or losing their jobs stemming from the drop in spending on travel and eating out.
Fortunately, there is a relatively simple way to address some of these inequities: The federal government can pass legislation to provide paid sick leave for all workers. Paid sick leave not only helps reduce transmission of disease, it also provides economic security for workers who might otherwise lose income if they have to take time off from work.
Federal legislators need to look no further than the states to find multiple models for paid sick days legislation. As the map shows below, 13 states and the District of Columbia require employers to provide paid sick leave, with Maine’s new paid leave law set to take effect in 2021. Each of these states sets an accrual rate defining how many hours of paid leave employers must provide based upon the hours worked, typically with some cap on leave that can be used per year. Covered employers vary somewhat across the states, with some states exempting small employers or setting varying accrual rates and usage caps based upon the size of the employer.
Why a fiscal stimulus that is big and fast is so necessary—and why it should continue so long as the economy is weak
Macroeconomists seem overwhelmingly worried that the COVID-19 shock could cause a significant recession, if unaddressed by policy. This message has still yet to get fully through to most policymakers, it seems.
Much of the policy discussion so far has focused, admirably enough, on targeting aid to workers likely to be directly affected by the virus itself and to reduced work caused by the “social distancing.” The responses to these issue have been proper: boosting the capacity of the health system, mandating emergency paid sick leave, reforms to unemployment insurance (UI), and providing free testing.
These measures are smart and well-meaning. However, they need to be supplemented by large-scale stimulus. Simply put, we need to do more to buffer the wider economy against the fallout of the COVID-19 shock.
As workers are laid off from directly affected industries (like restaurants and travel), their incomes will fall and so they will spend less money in even nonaffected industries. Because the industries directly affected by COVID-19 disproportionately employ low-wage workers with little wealth (and therefore little to no savings to turn to to maintain spending when they are laid off), the reduction in spending that will accompany wage losses will be even faster and sharper than in typical recessions. These spending cutbacks will then cause work reductions and income losses in nonaffected industries, and the vicious cycle will deepen.
One prime propagating mechanism that will make this vicious cycle worse if left unchecked is the response of state and local government spending. A negative economic shock causes tax revenues in these governments to fall. Balanced budget rules at the state and local levels will cause spending to contract, putting further downward pressure on economic growth.
In short, the economic shock from COVID-19 will come extraordinarily fast and be very broad and will have a large effect on the economy. This means that even after targeted interventions are undertaken, quick-acting and large economic stimulus will be needed.Read more
Union workers are more likely to have paid sick days and health insurance: COVID-19 sheds light on least-empowered workers
The COVID-19 pandemic highlights the vast inequalities in the United States between those who can more easily follow the Center for Disease Control’s recommendation to stay home and seek medical attention when needed and those who cannot. High-wage earners are more likely to be able to stay home and to have health insurance to seek medical care than low-wage earners. And, those in certain sectors—e.g., information and financial activities—are more likely to have paid sick days or be able to work from home than those in other sectors—e.g., leisure and hospitality. COVID-19 also sheds light on another difference in economic security and access to medical care among workers: the benefits to being in a union.
Union workers are more likely to have access to paid sick days and health insurance on the job than nonunion workers. The figure below shows the significant differences in those rates using the National Compensation Survey.
Only two-thirds of nonunion workers have health insurance from work compared with 94% of union workers. Having health insurance means workers are more able to seek and afford the care they need. We know in that the United States, millions of people delay getting medical treatment because of the costs. Without health insurance, many do not have a regular source of care and simply won’t go to the doctor to get the attention and information they need to not only get better but also reduce the spreading of disease.
Union workers are more likely to have paid sick days and health insurance on the job: Share of private-sector workers with access to paid sick days and health insurance, by union status, 2019
| Union | Nonunion | |
|---|---|---|
| Access to paid sick leave benefits | 86% | 72% |
| Access to health care benefits | 94% | 67% |
Source: U.S. Bureau of Labor Statistics, National Compensation Survey 2019
Union workers are also more likely to be able to stay home when they are sick because they are more likely to have access to paid sick leave. 86% of unionized workers can take paid sick days to care for themselves or family members, while only 72% of nonunion workers can.
Having a union allows workers and their families access to more tools to help them withstand the coronavirus pandemic. Union workers are more likely to be able to stay home and seek medical care, which will help strengthen their communities by being less likely to spread the virus.
Teachers pay out-of-pocket to keep their classrooms clean of COVID-19: Teachers already spend on average $450 a year on school supplies
“I keep my surfaces as clean as possible, wipe down tables every day, and use sanitizer, but it becomes an expense, because the district doesn’t give us wipes or sanitizer for our classrooms,” Kristin Luebbert, a teacher at the U School in North Philadelphia, recently told The Philadelphia Inquirer. “It’s just a worry—what’s the plan and how are we going to be safe?”
With fears over COVID-19 spreading throughout the nation’s classrooms, there is understandably a push to maintain cleanliness in all schools. Even the Centers for Disease Control weighed in with recommendations for schools and teachers in particular too: clean and disinfect frequently touched surfaces and objects in the classroom.
The question is who’s going to pay for the products needed to protect students and teachers?
Turns out, some teachers are using their own money to cover the cost of things such as hand sanitizers and wipes, according to some published reports on the issue. That expense is in addition to the, on average, $459 teachers spend on school supplies for which they are not reimbursed (adjusted for inflation to 2018 dollars), found an analysis by Economic Policy Institute economist Emma García.
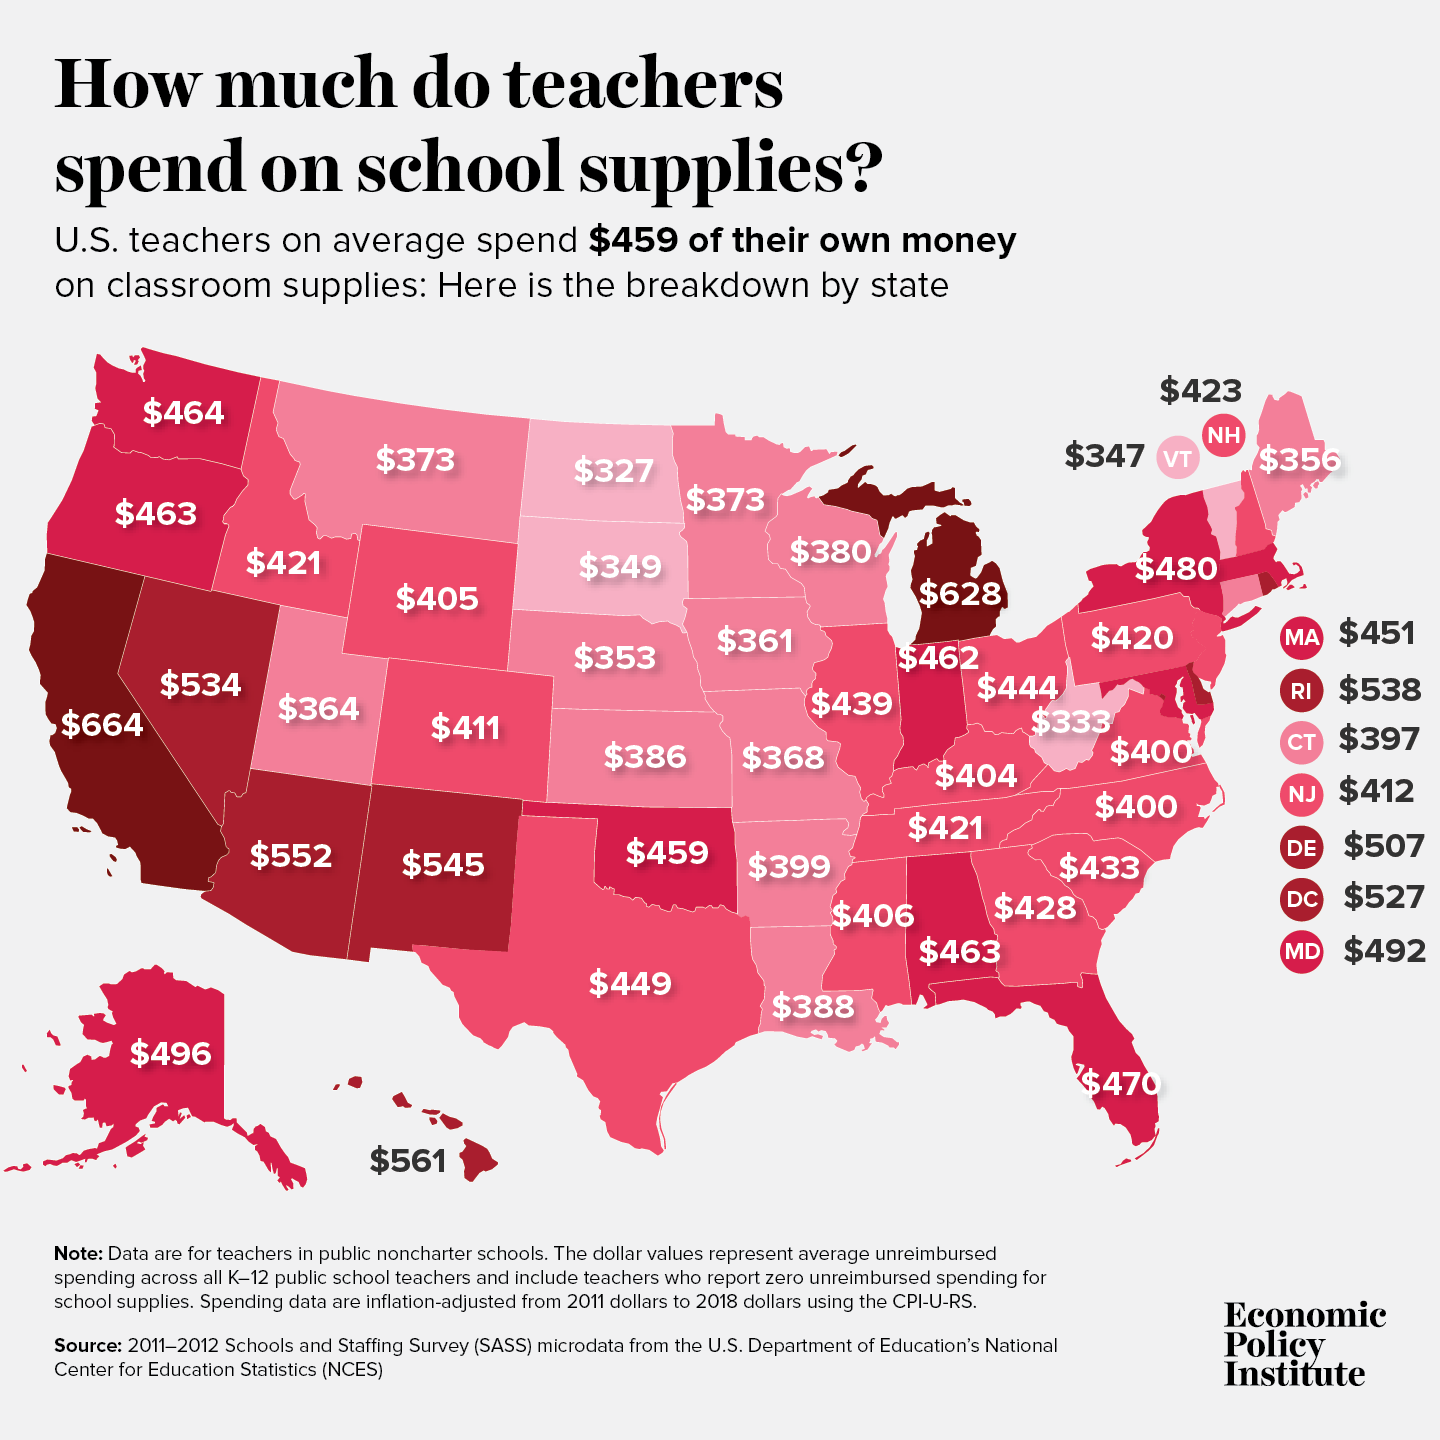
“What’s ahead for teachers in light of the threat of COVID-19 spreading will only add to the existing challenges and stress,” predicts García. “Teachers already act as first respondents when it comes to children’s basic needs, and schools are the only place where some students can have access to hot meals, medical care, washing their dirty laundry, or even to shelter. These, as well as the expense outlays, are worse in schools serving larger shares of low-income students.”Read more
Trump’s payroll tax cuts are a terrible opening bid to address the economic fallout of COVID-19: But employer tax credits can be part of the economic response if they finance direct benefits for workers
Unconditional tax cuts for employers are a terrible policy response to the economic fallout of COVID-19. But employer tax credits that are tied to the provision of specific benefits for workers can be a useful way to deliver emergency help. In the long run, key benefits like paid sick leave and strong unemployment insurance should not rest on employer tax credits, but these credits might be the best way to deliver emergency benefits right now.
The Trump administration has put forward the idea of cutting both employee- and employer-side payroll taxes as the centerpiece of an economic response to the COVID-19 epidemic. This is a terrible opening bid. In late 2010, the Obama White House and a Republican-led Congress agreed on a temporary payroll tax cut for employees only as a compromise measure to provide economic stimulus.
But the employee-side payroll tax cut is an even worse potential compromise this time. One reason is that it would not get enough money out the door and into households’ pockets quickly enough. A COVID-19 recession will come fast and people will need lots of help quickly. A payroll tax cut will dribble out gradually over time. Another reason is the employee-side payroll tax cut is poorly targeted and sends lots of money to high-income households. A COVID-19 recession is laser-targeted at sectors with lots of low-wage workers, and the response should be too. So, even employee-side payroll tax cuts are a poor centerpiece of any policy package responding to the coming slowdown.
Employer-side payroll tax cuts are even much worse. They are a pure windfall to business and would do nothing for workers in the short run. These employer-side cuts should be flatly opposed.
There is, however, a potential role for employer tax credits as a way to stand-up emergency paid sick leave or work sharing or unemployment insurance. The optimal way for these programs to work is to have them be an ongoing part of our social safety net that take effect automatically during downturns. In the case of work-sharing and unemployment insurance, these should be social insurance programs financed in the long run by payroll taxes. Paid sick leave should be a mandated labor standard. But since we do not have strong systems in place to provide these benefits to workers affected by the economic fallout of COVID-19 in the short run, and because placing new costs on employers just as revenue potentially craters might not be optimal, we could use employer tax credits to finance the emergency provision of key benefits like paid sick leave and expanded unemployment insurance.
Economists Jared Bernstein and Jesse Rothstein, for example, have a proposal to use employer tax credits to finance quicker-acting unemployment insurance that allows workers to stay on payroll and be paid even while not working during a COVID-19 downturn. Dean Baker made a similar proposal as the Great Recession loomed.
Policy discussions about buffering the economy from the COVID-19 shock are moving very quickly and lines are being drawn. It remains the case that large direct payments to households and having the federal government pick up states’ Medicaid spending for a year are likely the most valuable macroeconomic support that could be provided because they’re well-targeted to counteract the particular damage inflicted by a COVID-19 recession.
It also remains the case that unconditional employer tax cuts should be rejected flatly as a solution. But there does remain a potential role for employer tax credits in helping deliver benefits to workers. As long as these tax credits are used solely for this purpose, they should be considered.
A Trump attack on government, flying largely under the radar: Trump wants to help corporations suspected of violating the law
Health inspections of cruise ships, to reduce the spread of infections. A recall of flammable infant sleepwear. An order to clean up contaminated soil or water. This work of the federal government often lets us take for granted the safety of the food we eat, the clothes we put on our kids, and even our collective ability to fight new illnesses like the coronavirus.
We can’t take it for granted anymore. An obscure agency that most Americans have never heard of has issued a request for information that one-sidedly solicits input about how government is a problem, with the transparent goal of creating more roadblocks to government enforcement of environmental, consumer protection, labor, and other regulations. Right-wing groups are already mobilizing a campaign in response, prompting scores of comments expressing fervent yet vague support for the president. Many more comments are surely in the works, by corporations offering more polished and pointed explanations of their need to operate unfettered. The Trump administration has made clear its intent to do their bidding and more, but we don’t have to make it easy. Think tanks, public interest lawyers, community and advocacy organizations, and the general public can and should weigh in, to protect the government’s basic ability to protect our shared well-being.
At the hub of the agencies that report to the president is the Office of Management and Budget (OMB), which sets rules across the federal government for what agencies do and how they behave. In late January, the OMB issued a highly unorthodox request that assumes agencies behave unfairly, and asks how to make agency actions friendlier to alleged lawbreakers. It’s a clear invitation to corporate wrongdoers to provide anecdotes masquerading as evidence. The OMB’s head characterized the request as a means to end “bureaucratic bullying.” They’ve already decreed that agencies must repeal two rules for every new one they issue, no matter the harm to the public; this request is another effort to hamstring the government’s ability to pursue corporate wrongdoing.
The OMB’s request strangely floats importing criminal due process concepts into the civil administrative context. It asks whether there should be an “initial presumption of innocence,” for example, and whether investigated parties should be able “to require an agency to ‘show cause’ to continue an investigation.” But we are talking about corporations under civil investigation based on potential harm to broad swaths of people. If a business is suspected of polluting a playground, do we really want to slow down investigation and enforcement? Most of us would prefer swift government action in such circumstances.Read more
Amid COVID-19 outbreak, the workers who need paid sick days the most have the least
The United States is unprepared for the COVID-19 pandemic given that many workers throughout the economy will have financial difficulty in following the CDC’s recommendations to stay home and seek medical care if they think they’ve become infected. Millions of U.S. workers and their families don’t have access to health insurance, and only 30% of the lowest-paid workers have the ability to earn paid sick days—workers who typically have lots of contact with the public and aren’t able to work from home.
There are deficiencies in paid sick days coverage per sector, particularly among those workers with a lot of public exposure. Figure A displays access to paid sick leave by sector. Information and financial activities have the highest rates of coverage at 95% and 91%, respectively. Education and health services, manufacturing, and professional and business services have lower rates of coverage, but still maintain at least three-quarters of workers with access. Trade, transportation, and utilities comes in at 72%, but there are significant differences within that sector ranging from utilities at 95% down to retail trade at 64% (not shown). Over half of private-sector workers in leisure and hospitality do not have access to paid sick days. Within that sector, 55% of workers in accommodation and food services do not have access to paid sick days (not shown).
Workers face stark differences in access to paid sick days, depending on what sector they work in: Share of private-sector workers with access to paid sick days, by sector, 2019
| Sector | Share of workers who with paid sick leave |
|---|---|
| Information | 95% |
| Financial activities | 91% |
| Education and health services | 84% |
| Manufacturing | 79% |
| Professional and business services | 76% |
| Trade, transportation, and utilities | 72% |
| Other services | 59% |
| Construction | 58% |
| Leisure and hospitality | 48% |
Source: U.S. Bureau of Labor Statistics, National Compensation Survey 2019.
Of the public health concerns in the workforce related to COVID-19, two loom large: those who work with the elderly, because of how dangerous the virus is for that population, and those who work with food, because of the transmission of illness. Research shows that more paid sick days is related to reduced flu rates. There is no reason to believe contagion of COVID-19 will be any different. When over half of workers in food services and related occupations do not have access to paid sick days, the illness may spread more quickly.
What exacerbates the lack of paid sick days among these workers is that their jobs are already not easily transferable to working from home. On average, about 29% of all workers can work from home. And, not surprisingly, workers in sectors where they are more likely to have paid sick days are also more likely to be able to work from home. Over 50% of workers in information, financial activities, and professional and business services can work from home. However, only about 9% of workers in leisure and hospitality are able to work from home.
Many of the 73% of workers with access to paid sick days will not have enough days banked to be able to take off for the course of the illness to take care of themselves or a family member. COVID-19’s incubation period could be as long as 14 days, and little is known about how long it could take to recover once symptoms take hold. Figure B displays the amount of paid sick days workers have access to at different lengths of service. Paid sick days increase by years of service, but even after 20 years, only 25% of private-sector workers are offered at least 10 days of paid sick days a year.
The small sliver of green shows that a very small share (only about 4%) of workers—regardless of their length of service—have access to more than 14 paid sick days. That’s just under three weeks for a five-day-a-week worker, assuming they have that many days at their disposal at the time when illness strikes. The vast majority of workers, over three-quarters of all workers, have nine days or less of paid sick time. This clearly shows that even among workers with access to some amount of paid sick days, the amounts are likely to be insufficient.
Sufficient paid sick days provisions in the case of COVID-19 are scarce: Share of workers with access to paid sick days by number of days and length of service
| Access to more than 14 sick days | Access to 10–14 sick days | Access to 5–9 sick days | Access to less than 5 sick days | |
|---|---|---|---|---|
| After one year of service | 3 % | 18% | 54% | 25% |
| After five years of service | 4 | 19 | 54 | 24 |
| After 10 years of service | 4 | 19 | 54 | 23 |
| After 20 years of service | 4 | 19 | 54 | 23 |
Source: U.S. Bureau of Labor Statistics, National Compensation Survey 2019
Getting serious about the economic response to COVID-19
With the stock market plummeting and hysteria around COVID-19 (commonly known as the coronavirus) escalating, it is time to get serious about the economic policy response. Policymakers and the public will need help in distinguishing between smart responses and those that are just ideological opportunism, such as calls for cuts in taxes and regulations, for example.
Simply put, smart responses must be tailored to the type of recession the outbreak could cause if policymakers don’t act.
The three key elements of a potential COVID-19 recession are:
- If it comes, it will come fast.
- It will hit lower-wage workers first and hardest.
- It will impose even faster and larger costs on state and local governments than recessions normally do.
Each one of these should be targeted directly.
Any economic relief package should come online quickly, it should be even more targeted to help lower-wage workers than usual, and it should rapidly boost state and local government capacity on both the public health and economic fronts. Below I sketch out why these characteristics of the COVID-19 slowdown are likely, and what a tailored response to each would be.
First, if the COVID-19 outbreak slows the economy, it could happen very rapidly. This is quite different, for example, than the onset of the Great Recession. That recession was caused by the bursting of the home price bubble, which essentially began in mid-2006. From that point on the recession was near-inevitable, but it took literally years to gather steam. As the Great Recession loomed, the key characteristics policymakers should have demanded of any proposed stimulus package should have been: effective, large, and sustained. Fiscal policymakers decisively failed on the last point, and dwindling fiscal support hampered recovery for years.
A COVID-19 driven recession would be quite different in that it would hit quickly. The spread of the disease has been quite rapid in each country it has affected. Further, the public health response to maintain “social distancing” to thwart its spread tends to take effect rapidly as well. Even before the reported cases in the U.S. have reached large numbers, the news are full of cascading cancellations of business and entertainment gatherings. We are almost certainly already feeling the economic effects of the COVID-19 slowdown—it just has not appeared in economic statistics yet (since these statistics tend to appear with a small lag).Read more
Even HBO’s John Oliver didn’t provide the full context on ‘Medicare for All’ and jobs
There’s a lot of rhetoric out there right now about how providing “Medicare for All” (M4A) could destroy the economy or lead to ruinous tax increases. But one bright spot was HBO host John Oliver’s monologue on the plan that went viral last month.
Oliver took a characteristically in-depth look at the issues and was largely positive about how M4A could help a “badly broken” health care system given the millions of people who are uninsured and underinsured. Crucially, he noted that we’re going to pay for health care one way or the other, and M4A largely doesn’t add to the costs we pay (indeed, it could well reduce them significantly in the long run), instead it just changes how we pay these costs—substituting taxes for premiums.
Oliver provided a comprehensive accounting of the benefits of the health care proposal, but he also raised some possible pitfalls, including the jobs that could be lost given the elimination of the private health insurance industry. The problem is he quoted a 1.8 million job-loss figure that’s been widely circulated but is widely misleading when presented without context, as I explain in my new analysis of M4A’s impact on the labor market.
What to watch on jobs day: Expected future impact of COVID-19
As COVID-19—commonly known as the coronavirus—continues to spread throughout the world, it is likely to have a direct impact on the United States through the health and well-being of our population. It is also likely to have an impact on economic activity, as workers stop working to care for themselves or their families, and people generally reduce social spending. I’ll be watching this in tomorrow’s job report from the Bureau of Labor Statistics, and keeping an eye on it in the coming months. The first order of business, however, is to make sure that workers can follow the Centers for Disease Control and Prevention (CDC)’s recommendations to stay home and seek medical care—if they are lucky enough to have paid sick days and health insurance. While there are still very few reported cases in the United States, it is expected to spread and the effects may be far-reaching.
In terms of the economy, there has already been an impact on the manufacturing sector as inputs from China are delayed because of temporary factory closures. The Federal Reserve has cut interest rates in expectation of further economic disruptions. Many employers are making contingencies for workers to telecommute rather than risk illness. Unfortunately, this isn’t an option for millions of workers in direct service professions across the economy. Another likely side effect of the pandemic is a pull-back on social consumption. Either because people become sick themselves or are avoiding public spaces, there will likely be a drop in certain types of spending across the economy.Read more
Low-wage workers saw the biggest wage growth in states that increased their minimum wage between 2018 and 2019
Twenty-three states and the District of Columbia raised their minimum wage in 2019 through legislation, referendum, or because the minimum wage was indexed to inflation in those states. Low-wage workers in these states saw much faster wage growth than low-wage workers in states that did not increase their minimum wage between 2018 and 2019, as shown in EPI’s latest State of Working America Wages report. This blog post dives a bit deeper by dispelling some tempting explanations for what might be happening, such as stronger across-the-board wage growth in those states (didn’t happen) or employment losses (not borne out in the data).
Figure A shows in green the states with minimum wage increases that occurred through legislation or referendum in 2019, while states in blue had automatic increases resulting from indexing the minimum wage to inflation. Workers in states that increased their minimum wage between 2018 and 2019 account for about 55% of the U.S. workforce. The nominal minimum wage increases ranged from $0.05 (0.5%) in Alaska to $1.00 (9.1%−10.0%) in California, Massachusetts, and Maine.
The minimum wage increased in 23 states and the District of Columbia in 2019: States with minimum wage increases in 2019, by type of increase
| State | Abbreviation | Category |
|---|---|---|
| Alaska | AK | Indexed |
| Alabama | AL | No change |
| Arkansas | AR | Legislated or ballot measure |
| Arizona | AZ | Legislated or ballot measure |
| California | CA | Legislated or ballot measure |
| Colorado | CO | Legislated or ballot measure |
| Connecticut | CT | Legislated or ballot measure |
| District of Columbia | DC | Legislated or ballot measure |
| Delaware | DE | Legislated or ballot measure |
| Florida | FL | Indexed |
| Georgia | GA | No change |
| Hawaii | HI | No change |
| Iowa | IA | No change |
| Idaho | ID | No change |
| Illinois | IL | No change |
| Indiana | IN | No change |
| Kansas | KS | No change |
| Kentucky | KY | No change |
| Louisiana | LA | No change |
| Massachusetts | MA | Legislated or ballot measure |
| Maryland | MD | Legislated or ballot measure |
| Maine | ME | Legislated or ballot measure |
| Michigan | MI | Legislated or ballot measure |
| Minnesota | MN | Indexed |
| Missouri | MO | Legislated or ballot measure |
| Mississippi | MS | No change |
| Montana | MT | Indexed |
| North Carolina | NC | No change |
| North Dakota | ND | No change |
| Nebraska | NE | No change |
| New Hampshire | NH | No change |
| New Jersey | NJ | Legislated or ballot measure |
| New Mexico | NM | No change |
| Nevada | NV | No change |
| New York | NY | Legislated or ballot measure |
| Ohio | OH | Indexed |
| Oklahoma | OK | No change |
| Oregon | OR | Legislated or ballot measure |
| Pennsylvania | PA | No change |
| Rhode Island | RI | Legislated or ballot measure |
| South Carolina | SC | No change |
| South Dakota | SD | Indexed |
| Tennessee | TN | No change |
| Texas | TX | No change |
| Utah | UT | No change |
| Virginia | VA | No change |
| Vermont | VT | Indexed |
| Washington | WA | Legislated or ballot measure |
| Wisconsin | WI | No change |
| West Virginia | WV | No change |
| Wyoming | WY | No change |
Notes: Minimum wage increases passed through either legislation or ballot measure took effect on January 1, 2019, in Arkansas, Arizona, California, Colorado, Delaware, Maine, Massachusetts, Michigan, Missouri, New York, Rhode Island, and Washington. Alaska, Florida, Minnesota, Montana, New Jersey, Ohio, South Dakota, and Vermont increased their minimum wages in 2019 because of indexing to inflation. New Jersey, Oregon, and Washington, D.C., legislated minimum wage increases that took effect on July 1, 2019. Note that Connecticut legislated a minimum wage increase that took effect on October 1, 2019. This sample considers all changes after January 2018 and before December 2019; therefore, Maryland is included even though the legislated minimum wage increase for Maryland took effect on July 1, 2018. Note that after indexing to inflation on January 1, 2019, New Jersey legislated a minimum wage increase on July 1, 2019; therefore, New Jersey appears twice in these lists.
Source: EPI analysis of state minimum wage laws. See EPI’s minimum wage tracker for the most current state-level minimum wage information.
Figure B compares 10th-percentile wage growth in states with minimum wage increases compared with those without increases. Growth at the 10th percentile in states without minimum wage increases was much slower (0.9%) than in states with any kind of minimum wage increase (4.1%). This result holds true for both men and women. The 10th-percentile men’s wage grew 3.6% in states with minimum wage increases, compared with 0.7% growth in states without any minimum wage increases, while women’s 10th-percentile wages grew 2.8% in states with minimum wage increases and 1.4% in states without.
Wage growth at the bottom was strongest in states with minimum wage increases in 2019: 10th-percentile wage growth, by presence of 2019 state minimum wage increase and by gender, 2018–2019
| States with minimum wage increases | States without minimum wage increases | |
|---|---|---|
| Overall | 4.1% | 0.9% |
| Men | 3.6% | 0.7% |
| Women | 2.8% | 1.4% |
Notes: Minimum wage increases passed through either legislation or ballot measure took effect on January 1, 2019, in Arkansas, Arizona, California, Colorado, Delaware, Maine, Massachusetts, Michigan, Missouri, New York, Rhode Island, and Washington. Alaska, Florida, Minnesota, Montana, New Jersey, Ohio, South Dakota, and Vermont increased their minimum wages in 2019 because of indexing to inflation. New Jersey, Oregon, and Washington, D.C., legislated minimum wage increases that took effect on July 1, 2019. Note that Connecticut legislated a minimum wage increase that took effect on October 1, 2019. This sample considers all changes after January 2018 and before December 2019; therefore, Maryland is included even though the legislated minimum wage increase for Maryland took effect on July 1, 2018. Note that after indexing to inflation on January 1, 2019, New Jersey legislated a minimum wage increase on July 1, 2019; therefore, New Jersey appears twice in these lists.
Sources: Author’s analysis of EPI Current Population Survey Extracts, Version 1.0 (2020), https://microdata.epi.org, and EPI analysis of state minimum wage laws. See EPI’s minimum wage tracker for the most current state-level minimum wage information.
Economic policy and COVID-19—Mitigate harm and plan for the future: A list of considerations for policymakers
The direct cost that COVID-19 inflicts on human health is obviously its most important effect on society. But this direct cost can be worsened by flawed economic and policy structures. And the indirect damage the disease causes through economic ripple effects could be large, so policymakers should do everything they can to minimize them.
Past decisions that have weakened our economic policy infrastructure will hamper our response to COVID-19; this is already baked into the cake. But there are some short-run ameliorative actions we can take that might help, and there are long-run policy changes that will aid our response to future epidemics.
In technical economic terms, COVID-19 combines potential supply shocks with sector-specific demand shocks. Basically, supply shocks hamper our ability to produce goods and services, and demand shocks are sharp cutbacks in spending from households, businesses, or governments. Below I provide a list for policymakers of what could/should be considered to deal with some of these.
The supply shocks come from disrupted global value chains, as, for example, Chinese production of inputs used by U.S. manufacturing and construction firms are not delivered on time because Chinese factories have temporarily closed. In countries where schools are shut down for long periods of time, a shock to labor supply can occur as working parents have to stay home to care for kids.
The potential sector-specific demand shock is to businesses where consumption is largely social—done with other people around. Think bars, restaurants, grocery stores, and malls. As people avoid social contact to minimize disease transmission, this leads to less activity in these sectors.
These effects mean it will be hard indeed for policymakers to spare the economy any pain from this.
There’s very little that can be done about the supply-side shocks—particularly in the short run. Demand-side shocks are generally easier to address with policy (in theory—policymakers still often fumble the ball in this regard), but the specific nature of the demand shocks associated with COVID-19 make them slightly harder to address. Simply giving households more money won’t boost consumption much in the sectors likely to be affected—the pullback in consumption is not driven by income constraints, but due to concerns over catching the illness.
EPI President Thea Lee testifies before the House Committee on Ways and Means on U.S.–China Trade and Competition (Video)
On February 26, EPI President Thea Lee testified before the House Committee on Ways and Means on the impact of the imbalanced U.S.–China economic relationship on U.S. jobs, wages, businesses, and long-term growth.
In her testimony, Lee discussed the history of U.S. trade policy toward China, problems with Trump’s “phase one” deal with China, and fundamental flaws in the U.S.–China economic relationship. According to new EPI research, the growing U.S.–China trade deficit was responsible for the loss of 3.7 million U.S. jobs between 2001 and 2018. These job losses are spread across all 50 states and the District of Columbia—and every congressional district in America.
Watch her testimony:
Lack of paid sick days and large numbers of uninsured increase risks of spreading the coronavirus
COVID-19—commonly known as the coronavirus—is now a potential threat for the United States and we all “need to be preparing for significant disruption of our lives,” warned the Centers for Disease Control and Prevention (CDC) this week.
Unfortunately, preparing for the “significant disruption” will be economically unimaginable for one group of Americans—the millions of people in the United States who do not have access to paid sick days or have health insurance with a regular health care provider.
The CDC released very clear instructions to help prevent the spread of respiratory diseases, including staying home when you are sick. Not everyone has that option.
Overall, just under three-quarters (73%) of private-sector workers in the United States have the ability to earn paid sick time at work. And, as shown in Figure A, below, access to paid sick days is vastly unequal. The highest-wage workers are more than three times as likely to have access to paid sick leave as the lowest-paid workers. Whereas 93% of the highest-wage workers had access to paid sick days, only 30% of the lowest-paid workers are able to earn sick days. In this way, access to paid sick days increases with wages among workers, disproportionately denying workers at the bottom this important security. And low-wage workers are more likely to be found in occupations where they have contact with the public—think early care and education workers, home health aides, restaurant workers, and food processors. When workers or their family members are sick, they shouldn’t have to decide between staying home from work to care for themselves or their dependents and paying rent or putting food on the table. But that is the situation our policymakers have put workers in.
Black-white wage gaps are worse today than in 2000
This week, my colleagues hosted a discussion on the policies that the 2020 presidential candidates should focus on in order to help black workers in the economy. One of the challenges that the presidential candidates should discuss is how to reduce the black–white wage gap—which has stubbornly persisted over the last four decades. Black-white wage gaps are large and have gotten worse in the last 20 years.
The latest findings on wage growth as documented in EPI’s State of Working America Wages 2019 report indicate wages in general are slowly improving with the growing economy, but wage inequality has grown and wage gaps have persisted, and in some cases, worsened. In this post, I will highlight the worsening black-white wage gap and look at it from multiple dimensions. Since 2000, by any way it’s measured, the wage gap between black and white workers has grown significantly.
The figure below compares wages for black and white workers over the last 19 years, highlighting the gaps in wages in 2000, the last time the economy was closest to full employment, 2007, the last business cycle peak before the Great Recession, and 2019, the latest data available. Against these benchmarks, I illustrated the growth in the average gap, the gap for low-, middle-, and high-wage workers, the gap for workers with a high school diploma, a college degree, and an advanced degree, and a regression-adjusted wage gap (controlling for age, gender, education, and region).
Black–white wage gaps widen across multiple measures: Black–white wages gaps at different points in the wage distribution, by education, and regression-based, 2000, 2007, and 2019
| 2000 | 2007 | 2019 | |
|---|---|---|---|
| Average | 21.8% | 23.5% | 26.5% |
| 10th percentile | 6.2% | 8.7% | 9.0% |
| Median | 20.8% | 22.3% | 24.4% |
| 95th percentile | 28.0% | 28.3% | 34.7% |
| High school | 15.3% | 17.4% | 18.3% |
| College | 17.2% | 19.2% | 22.5% |
| Advanced degree | 12.5% | 16.7% | 17.6% |
| Regression-based | 10.2% | 12.2% | 14.9% |
Notes: Sample based on all workers ages 16 and older. The xth-percentile wage is the wage at which x% of wage earners earn less and (100-x)% earn more. Educational attainment is based on mutually exclusive categories: e.g., high school is high school only, etc. Similar results are found for those with less than high school or some college. The regression-adjusted black–white wage gap controls for education, age, gender, and region.
Source: Author’s analysis of EPI Current Population Survey Extracts, Version 1.0 (2020), https://microdata.epi.org.
The black–white wage gap is smallest at the bottom of the wage distribution, where the minimum wage serves as a wage floor. The largest black–white wage gap as well as the one with the most growth since the Great Recession, is found at the top of the wage distribution, explained in part by the pulling away of top earners generally as well as continued occupational segregation, the disproportionate likelihood for white workers to occupy positions in the highest-wage professions.
It’s clear from the figure that education is not a panacea for closing these wage gaps. Again, this should not be shocking, as increased equality of educational access—as laudable a goal as it is—has been shown to have only small effects on class-based wage inequality, and racial wealth gaps have been almost entirely unmoved by a narrowing of the black–white college attainment gap, as demonstrated by William Darity Jr. and others.
Black workers can’t simply educate their way out of the gap. Across various levels of education, a significant black–white wage gap remains. Even black workers with an advanced degree experience a significant wage gap compared with their white counterparts. And after controlling for age, gender, education, and region, black workers are paid 14.9% less than white workers.
While the wage gaps differ depending on measure, what is obvious from the trends displayed is that the gaps widened in the full business cycle 2000–2007 and continued to grow in the Great Recession and its aftermath. Even though the black unemployment rate has fallen precipitously over the last several years, wage growth has remained particularly weak for black workers.
As always, it’s important to remember the historical and social contexts for differences in black and white labor market experiences and labor market outcomes (see Razza). Workers’ ability to claim higher wages rests on a host of social, political, and institutional factors outside of their control. The systematic social deprivation and economic disadvantage is maintained and reinforced by those with economic and political power. Furthermore, occupational segregation plays a significant role in these gaps, for both black men and black women. And, black women, in particularly, can face larger wages gaps with white men than the sum of their parts, meaning the black women face a double wage penalty for their race and gender. The trends in black–white wage gaps found here are supported by other important research that shows that black-white wage gaps expanded with rising inequality from 1979 to 2015.
Given a long history of excluding black Americans from social and political institutions that boost wage growth, the stubbornness of racial wage gaps is less surprising. However, the fact that they are getting worse is troubling. The good news is that policy can make a difference.
We see in the figure that the minimum wage keeps the lowest-wage black workers from even lower wages. In states that increased in the minimum wage between 2018 and 2019, low-wage workers saw stronger wage growth than in states that had no increase in their minimum wage in that period. Raising the federal minimum wage would disproportionately benefit black workers because they are overrepresented among low-wage workers and are less likely to live in states or localities that have passed a minimum wage that is higher than the current federal minimum.
Aside from strengthening and enforcing labor standards such as the minimum wage, making it easier for workers to form unions can narrow the black–white wage gap. Black workers are more likely to be in a union than white and get a bigger wage boost to being in a union than white. Therefore, unions can help shrink the black–white wage gap. Related, research has shown that the decline of unionization led to an expansion of the black–white wage gap.
Using all fiscal and monetary policy levers to achieve and maintain high-pressure labor markets can improve relative labor market outcomes for black workers, including participation in the labor force and work hours as well as wage growth. The U.S. certainly saw this stronger across the board growth in the tight labor market of the late 1990s.
In 2019, black wages exceeded their 2000 and 2007 levels across the wage distribution for the first time in this recovery. I’m hopeful that as the economy continues to move toward genuine full employment, black workers will see their wages rise. But it will take more than a couple of years of a full-employment economy to close racial wage gaps and compensate for years of lower wages, lower incomes, and lower wealth.
The U.S. federal tax and spending system is the biggest tool to combat inequality, but it could do much more
Last week, we launched the U.S. Tax & Spending Explorer on the EPI website. It’s an interactive web feature designed to shed light on how the government (mostly the federal government) raises and spends money and how changes in taxes and spending over time either increase or decrease income inequality.
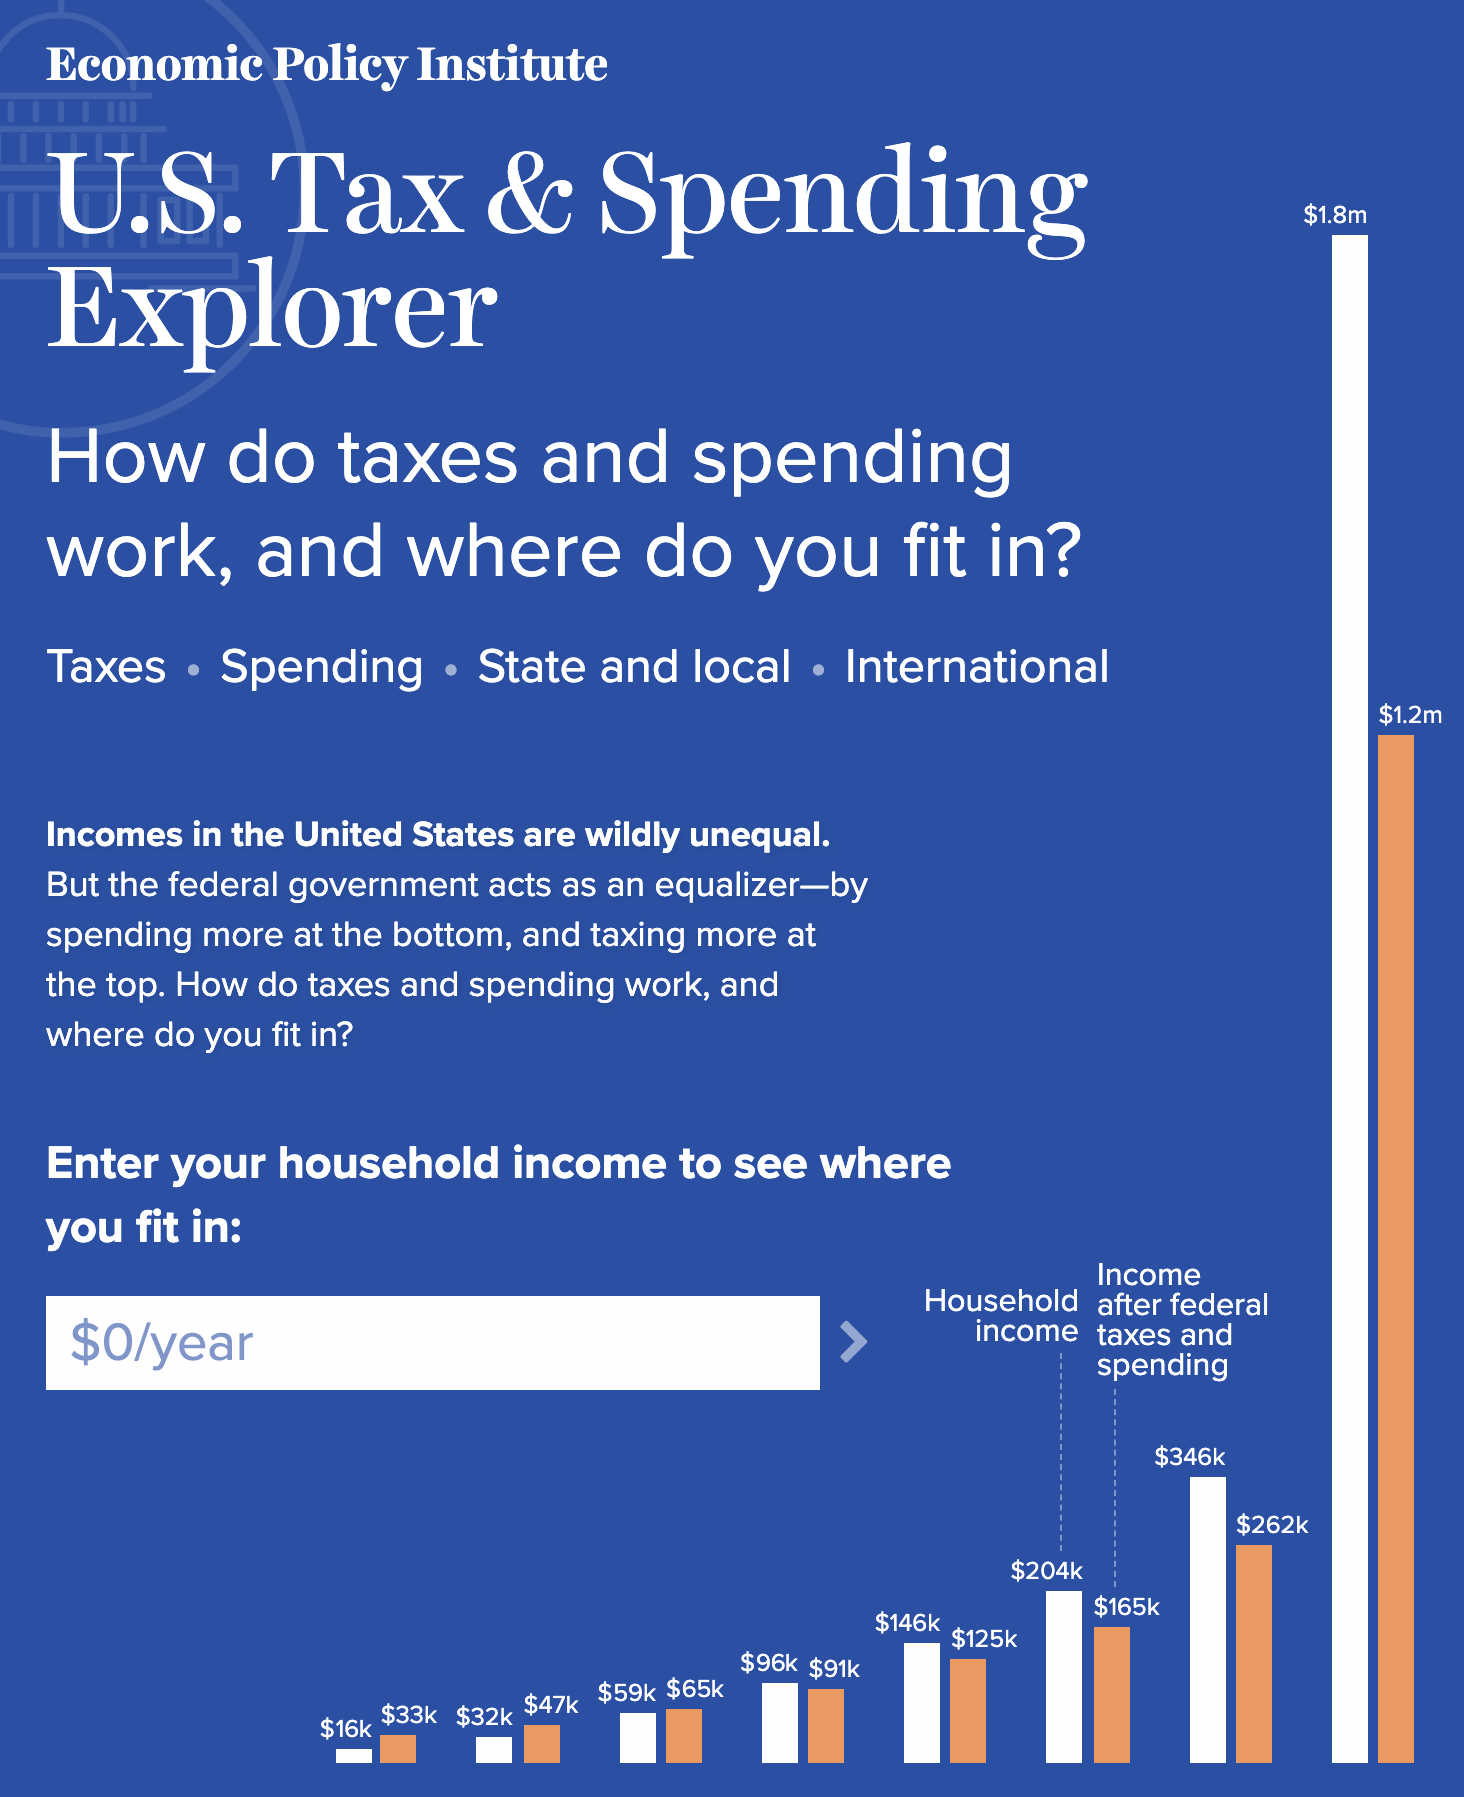
There’s enough granular detail in the feature that everybody might have different takeaways from visiting it. But here’s what strikes me looking at this data:
- Together, taxes and spending significantly reduce inequality at any given point in time relative to a world with a much smaller federal footprint. That’s the good news. The bad news is that since 1979 the inequality-reducing effect of taxes and spending hasn’t grown that much—but inequality has grown, a lot. We should use the proven inequality-fighting lever of a larger tax and spending system to combat the inequality that has risen so fast in recent decades.
Medicare4All C-Span discussion sheds light on its impact
Economic Policy Institute’s Director of Research Josh Bivens and American Enterprise Institute’s Jospeh Antos addressed the issue of Medicare for All, and the larger role health care policy is playing in Campaign 2020 on C-Span’s Washington Journal Saturday.
The United States needs movement forward on healthcare that makes it accessible and affordable, said Bivens during the discussion.
“I think there’s a real hunger out there for something for health reform,” he explained. “Health care is something that Americans worry about the most, not just their health but would means for financial security and that worry is well-placed. We have a uniquely dysfunctional health care system.
“We spend on a per capita basis about $10,000 per person, we have some great health systems in the world, number one in terms of health outcomes as France and the Netherlands who spend literally half of what we spend. One of the reasons why a single-payer plan would be expensive is because we still have 27 million uninsured people and 60 million underinsured people. So, yeah, it would be more expensive to give health care to people who need it, but that’s the virtue of a fundamental reform. Keeping costs down by keeping people excluded, seems to me as not the way to go.”
Bivens is the author of a soon-to-be released paper on the impact of fundamental health care reform, including Medicare for All, on wages and job quality.
Sign up here for EPI’s newsletter so you don’t miss the report’s release, or any other essential labor research, analysis and trends from EPI’s research team.
The Trump budget doesn’t spare seniors
President Trump’s proposed 2021 budget claims to help the “most vulnerable populations,” including seniors. But vulnerable older Americans are among those who would be most hurt if this draconian budget were ever enacted.
The budget would slash Medicaid and non-defense discretionary spending, eliminating or drastically shrinking programs targeted at low-income people, including programs benefiting seniors, such as the Low Income Home Energy Assistance Program. At first glance, the administration appears to spare middle-class seniors, a group with high voter turnout that tends to support the president and his party. Despite the president’s hints that Social Security and Medicare will be on the chopping block after the election, the budget would spare retirement benefits (except those for federal employees) and claims to achieve Medicare savings only by eliminating “excessive spending and distortionary payment incentives” while “preserv[ing] benefits and access to care.”
Some Medicare provisions in the president’s budget, such as site-neutral payments across different types of facilities, address genuine problems in how Medicare is administered. But the nearly half trillion in proposed savings from Medicare over 10 years includes provisions that would indirectly affect Medicare beneficiaries’ access to care, such as reducing payments to partially cover unpaid medical bills for Medicare beneficiaries. Since unlimited out-of-pocket expenses are a major cause of bankruptcy for older Americans in poor health, reducing these reimbursements would cause some providers to avoid treating Medicare patients who have expensive conditions and limited resources—and would surely lead to hospital and clinic closures in underserved areas. Middle-class seniors and providers who treat them wouldn’t be spared, since lower-middle-class seniors ineligible for Medicaid are those most likely to spend a high share of their income on health care. The problem of uncompensated care would be compounded by the administration’s attempts to roll back Medicaid expansion under the Affordable Care Act (ACA), which has helped hospitals treating low-income and uninsured patients in expansion states.
Top five Valentine’s Day gifts ideas for U.S. workers: Nothing spells ‘romance’ like a fair wage and quality jobs
That’s why we decided to sum up what we think are the top five Valentine’s Day gifts ideas for working people across the country.
Power through collective action!
Our economy is out of balance. Corporations and CEOs hold too much power and wealth, and working people know it. Workers are mobilizing, organizing, protesting, and striking at a level not seen in decades, and they are winning pay raises and other real change by using their collective voices.
But, the fact is, it is still too difficult for working people to form a union at their workplace when they want to. The law gives employers too much power and puts too many roadblocks in the way of workers trying to organize a union. The Protecting the Right to Organize (PRO) Act will go a long way toward restoring workers’ right to join together to bargain for better wages and working conditions by streamlining the process when workers form a union, ensuring that they are successful in negotiating a first agreement, and holding employers accountable when they violate labor law. The U.S. Senate should join the House of Representatives and pass the PRO Act in order to restore power to working people.
Affording bread…and roses
The real (inflation-adjusted) minimum wage is now roughly 30 percent lower than it was in 1968, and it has been more than 10 years since congress raised the minimum wage—the longest stretch in history. To end this shameful streak, it is incumbent upon the Senate to take up and pass the Raise the Wage Act immediately. Raising the federal minimum wage to $15 by 2025 would lift wages for 33.5 million workers across the country—more than one-fifth of the wage-earning workforce. The increase would boost total annual wages for these low-wage workers by $92.5 billion, lifting annual earnings for the average affected year-round worker by $2,800. Recent survey data have shown that 74% of U.S. workers live paycheck to paycheck. Policymakers should give working people the ability to make ends meet—but also the ability to treat themselves occasionally.
Failure to raise the federal minimum wage has taken thousands of dollars out of the pockets of minimum wage workers: The real value of the minimum wage (adjusted for inflation) is 17% less than 10 years ago and 31% less than in 1968
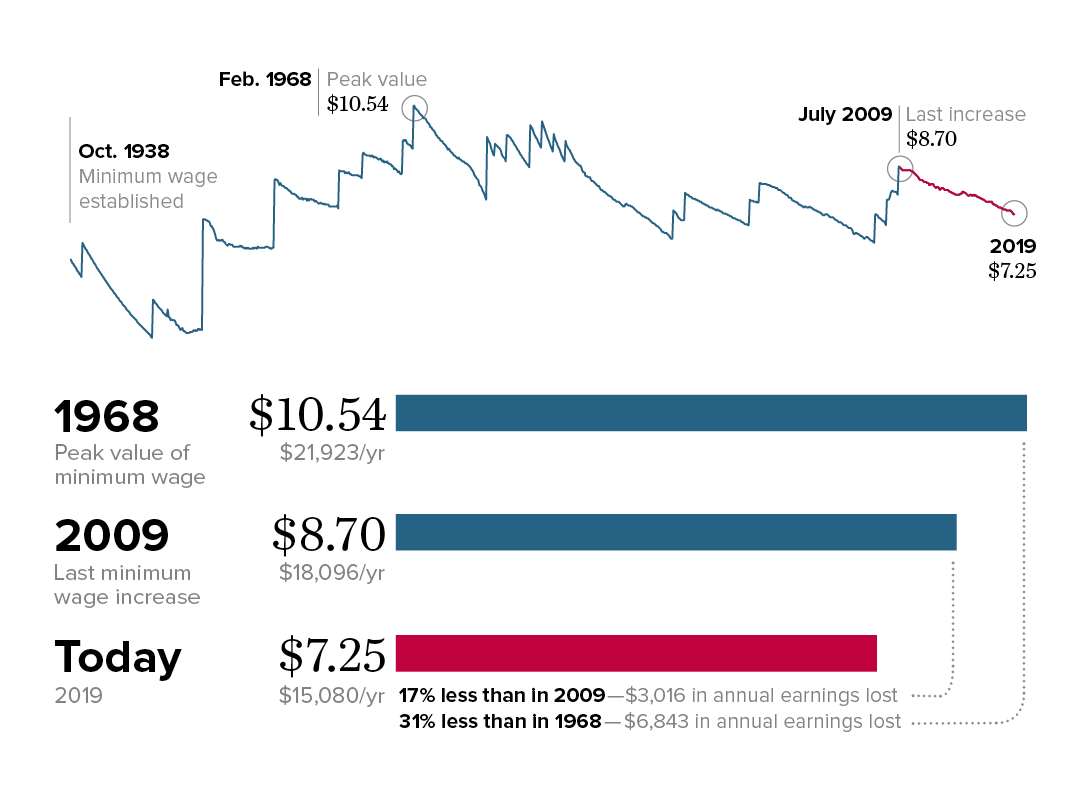
Note: All values are in June 2019 dollars, adjusted using the CPI-U-RS.
Source: Adapted from Figure C in David Cooper, Elise Gould, and Ben Zipperer, Low-Wage Workers Are Suffering from a Decline in the Real Value of the Federal Minimum Wage, Economic Policy Institute, August 2019).
Source: Adapted from Figure C in David Cooper, Elise Gould, and Ben Zipperer, Low-Wage Workers Are Suffering from a Decline in the Real Value of the Federal Minimum Wage, Economic Policy Institute, August 2019). The figure reflects EPI analysis of historical minimum wage data in the Fair Labor Standards Act and amendments.
Pay workers for their hours worked, or give them their time back
The U.S. Department of Labor announced in September its final overtime rule, which will set the salary threshold under which salaried workers are automatically entitled to overtime pay to $35,568 a year. The rule leaves behind millions of workers who would have received overtime protections under the much stronger rule, published in 2016, that Trump administration chose to abandon. A stronger overtime protection would pay more workers for working more than 40 hours a week, or allow them extra time with their families.
Seven states have already taken steps to raise the overtime threshold, but without further action, it’s estimated that 8.2 million workers who would have benefited from the 2016 rule will be left behind by the Trump administration’s rule, including 3.2 million workers who would have gotten new overtime protections under the 2016 rule and 5.0 million who would have gotten strengthened overtime protections under the 2016 rule. States should follow suit and extend the overtime protections so workers don’t continue to lose out on their hard-earned wages.
Let your workers move on
At least 36 million workers—27.8% of the private-sector workforce—are required to enter noncompete agreements. Noncompete agreements are employment provisions that ban workers at one company from going to work for, or starting, a competing business within a certain period of time after leaving a job. Establishments with high pay or high levels of education among workers are more likely to use noncompetes, but noncompetes agreements are also common in workplaces with low pay and low levels of education. More than a quarter (29.0%) of private-sector workers with an average hourly wage below $13.00 require noncompetes for all their workers. Noncompetes are part of a disturbing trend of employers requiring workers to sign away their rights. Noncompetes may be contributing to weak wage growth, given that changing jobs is how workers often get a raise. And given that noncompetes limit the ability of individuals to start businesses or take other jobs, it also is not difficult to see that noncompetes may be contributing to the declines in dynamism in the U.S. labor market. Congress should pass the bipartisan legislation, the Workforce Mobility Act of 2019, to prohibit noncompete agreements.
Labor protections for Uber drivers shuttling around Valentine’s couples
The General Counsel of the National Labor Relations Board recently released a memo claiming that Uber drivers are independent contractors, not employees of Uber. The reality is that these drivers have very little entrepreneurial freedom: Drivers can’t raise revenues because they can’t control prices or expand their customer base through marketing. Unlike a typical enterprise, Uber drivers do not build earnings as they get more experience. Uber drivers are not able to choose their customers—drivers are penalized for rejecting or not accepting trips. And after accounting for Uber’s commissions and fees and vehicle expenses, and taking into account the cost of a modest package of health insurance and other benefits equivalent to those earned by W-2 workers, Uber drivers earn the equivalent of $9.21 in hourly wages—less than what is earned by 90% of all other wage and salary earners, and below the minimum wage in 13 of the 20 major urban markets where Uber operates.
Recently, AB5 went into effect in California, a set of protections aimed at combatting the misclassification of workers as independent contractors, helping ensure that California’s employees have access to basic labor and employment protections denied to independent contractors including: minimum wage and overtime protections, paid sick days and family leave, workers’ compensation benefits, and unemployment insurance benefits. Policymakers across the country should take notice and provide similar protections to workers in their states.