Growth (or not) in real wages
There is no starker metric for our unequal age than the stagnation of American wages over the last generation. Since 1973, productivity has grown about 75 percent, while the compensation of the typical worker has grown only about 12 percent. Since 1979, the hourly median wage has grown less than 10 percent in real dollars, or an average annual raise of barely 4 cents. While wages grew for many workers in 2017, wage growth is still far slower—and more unequal—than where it needs to be.
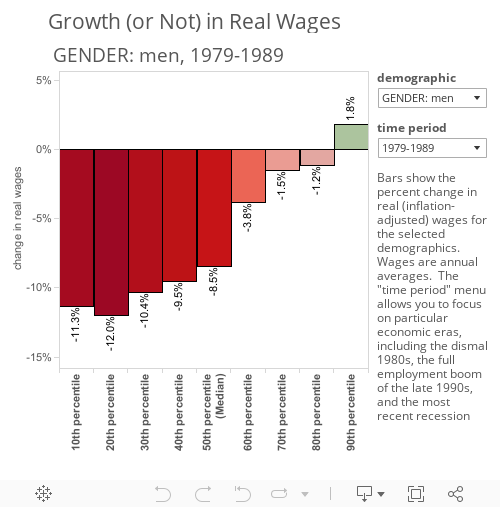
The interactive graphic below shows the change in real (inflation-adjusted) wages by wage decile, with drop-down filters for gender, race, educational attainment, and time period. This affords comparison of the wage gains (or losses) experienced by particular workers, and comparison across the full 1979–2017 span, or its constituent business cycles. The choice of “African-American” and “1979–1989,” for example, charts how black workers fared during the dismal 1980s; the choice of “BA or higher” and “2009–2017” charts how well-educated workers fared during the long recovery from the Great Recession.
There are a lot of moving pieces here—including shifting economic opportunities, changes in educational attainment, policy drifts and shifts, and five recessions that swallow up almost 6 of the 39 years since 1979. But here are four key takeaways:
First, growing wage inequality is the rule. Most demographic and chronological slices of this data yield a steep staircase, in which wage growth is crowded into the 80th and 90th deciles. For all workers from 1979–2017, for example, those earning at the median or below see gains of less than ten percent over that 39 year span; those at the 90th decile saw their wages rise more than 40 percent. For men, over the same era, workers at the median or below all suffer a net decrease in real wages; those at the 90th decile saw gains of over 32 percent.
Second, unions and labor standards matter. Consider the steep losses suffered by male workers (-8.5 percent at the median; -12 percent for those at the 20th decile) and by those with just a high school education in the 1980s. Union membership in the private sector fell from 21.2 percent to 6.5 percent between 1979 and 2017, with fully half of those losses coming in the 1980s (1979–1989 on the graphic). Union losses hurt women workers in the 1980s as well, but—for those in the 10th and 20th deciles—so did the fact that the minimum wage (in a long decade between legislated increases) lost over a third of its value. In the last decade (2017–2017), by contrast, there is a spike at the 10th percentile for most demographics—reflecting the profusion of state and local minimum wage increases recent years (17 states and the District of Columbia now have minimum wage of at least $9.00).
Third, full employment helps, a lot. The dismal wage record of the 1980s reflects not only union losses and slipping labor standards, but also a monthly unemployment rate that averaged nearly 8 percent over the decade. During the economic boom of the late 1990s (1995–2000 on the graphic), by contrast, near-full employment (the monthly unemployment rate average 4.9 percent over that span) conferred bargaining power even where union presence had withered. The result is not just broad-based wage growth but, for some demographics, an inverted staircase—with the highest gains at the lowest deciles.
Fourth, education is important (sort of). Returns to education are starkly evident here. Over the full 1979-2017 span, wage gains for those with a bachelor’s degree or better are strong—although they are also starkly unequal. For those with a high school education or less, that staircase is upside down; losses across the board, steepest at the higher deciles. The prospects for the same educational demographics in more recent years are mixed. For those with a BA or better, only those earning above the median show any gains. For those with only some college under their belts, the returns to education elude entirely.
Enjoyed this post?
Sign up for EPI's newsletter so you never miss our research and insights on ways to make the economy work better for everyone.