Costs will rise and coverage will fall under the AHCA
Yesterday, the Congressional Budget Office (CBO) released its analysis of the American Health Care Act (AHCA)—legislation designed to “repeal and replace” the Affordable Care Act (ACA). The AHCA makes substantial changes to current law, which have large effects on both the costs of care and the coverage rates. I’m going to walk through some key provisions and their effects on specific populations below, but the bottom line is that the number of uninsured Americans will grow by 24 million by the year 2026. This is the result of about 14 million fewer people on Medicaid, 2 million fewer with nongroup insurance coverage, and 7 million fewer with employer-sponsored health insurance. In addition to the outright losses in coverage, the law increases economic vulnerability and health insecurity for millions of Americans by disproportionately exposing those with low income to additional risk through the elimination of cost sharing subsidies in the nongroup market, forcing them to face higher out-of-pocket costs like higher deductibles and co-pays.
Some key highlights of the AHCA score can be found in one highly illuminating table and one brilliantly designed figure. Let’s start with the table. I’ve copied Table 4 below, highlighting some particularly interesting findings. (For full notes on this table, see page 34 of the CBO cost analysis.) The table constructs comparisons of various age profiles in two income groups for individuals seeking coverage in the health insurance nongroup market in 2026. Premiums, tax credits, net premiums, and actuarial value of plans for single individuals at age 21, age 40, and age 64 are constructed at income levels of $26,500 and $68,200 in the top and bottom panels, respectively.
Under the ACA, premium subsidies are available to people on an income-based sliding scale, limiting the cost of purchasing health insurance. Additionally, cost-sharing subsidies are also available on an income-based sliding scale, which limits exposure to high out-of-pocket costs like deductibles and co-pays. Under the proposed legislation, there are four major changes that affect Americans who want to buy insurance in the nongroup market. First, those cost-sharing subsidies are eliminated. Second, the premiums charged to older Americans can be up to 5 times greater than those charged to younger Americans, widening the maximum 1 to 3 ratio that exists under current law. Third, tax credits will be age-based rather than income-based for people with incomes below $75,000, at which point they begin phasing out to zero by $150,000. And, fourth, insurance companies will no longer be required to offer comprehensive coverage that shields beneficiaries from high out-of-pocket costs as a condition for being able to receive tax credits.
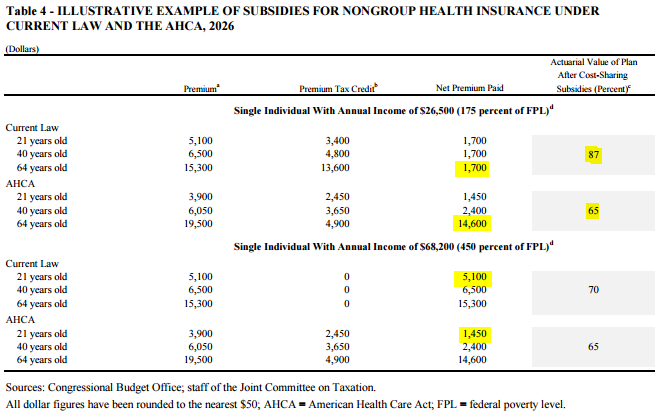
The combination of these changes have large effects on the premiums and out-of-pocket costs individuals pay in the nongroup market and when visiting doctors. Take the highlighted example in the top panel of a 64 year old with income of $26,200. Under current law, the gross premium (before subsidies) of $15,300 maxes out at three times the premium of the 21 year old ($5,100). But, given that that individual exposure to premiums is capped as a share of income, all age groups (with the same income) pay the same net premium of $1,700. This $1,700 pays for a plan that essentially provides generous coverage similar to what’s available to most people through employer-based insurance plans (specifically, it pays for a plan with an 87 percent actuarial value—a measure of the percentage of expected health care costs a specific health plan will cover for the population as a whole).
Under the proposed legislation, that same 64 year old with $26,200 in income would now be required to pay $14,600—over half their income—on a plan with a far lower actuarial value (because of the elimination of the cost-sharing subsidies). Not only does this subject that person to far higher and arguably unaffordable premiums, but it also requires much higher cost-sharing when they seek medical care. The research is pretty clear on what happens with increased cost sharing: it burdens patients who need care the most, leading some to reduce medically necessary (and sometimes cost-efficient) health care and others to risk their economic security.
Turning to the second panel, we can see a prototypical example of an individual who gains under the proposed legislation. The highlighted comparison is a 21 year old with income of $68,200. The first thing to note about this particular prototypical “winner” under the AHCA is how rare they will be: very few people in their early 20s make $68,000 annually. Under current law, their (unusually high) income at 450 percent of the federal poverty level is above the premium subsidy range, subjecting them to the entire gross premium of $5,100. Under the proposed legislation, their premiums would fall to $3,900 because the AHCA allows a larger spread between premiums charged to old and young people. Also, under the AHCA this relatively affluent young person is eligible for a premium tax credit of $2,450, lowering their net premium paid to $1,450. Their actuarial value also falls, but only by five percentage points, much smaller than the 22 percentage point loss the lower income 64 year old experiences. The reason for this smaller fall in actuarial value is that under the current ACA, people with incomes at 450 percent of the federal poverty level (FPL) are not eligible for cost-sharing subsidies. As this example illustrates, there is a clear cost shift from individuals who are young and high-income to individuals who are older and lower-income. And, regardless of income, because the new premium tax credit bands can only vary by as much as 2-to-1 for older versus younger enrollees, by design they disproportionately benefit the young (again, so long as they are affluent) in general. The additional cost-sharing requirements for older enrollees not only increase their financial and health risks, but CBO predicts it will lead to lower coverage in the nongroup market, particularly for older Americans.
Overall, health insurance coverage rates are expected to be much lower under the proposed legislation than under current law by 2026. Only two million of that loss in coverage comes from the nongroup market (though there will be compositional effects within that group as older Americans find the nongroup market increasingly unaffordable and younger people find it increasingly desirable). Meanwhile, by 2026, an additional seven million fewer Americans will have employer-sponsored health insurance due to a combination of fewer employees taking it up and fewer employers offering it, as well as the AHCA’s repeal of the individual mandate, which incentivizes people to seek insurance coverage from employers if they can. More than half of the loss in coverage, relative to current law, comes from 14 million fewer people on Medicaid. The proposed legislation shifts the costs of the ACA Medicaid expansion to the states, by cutting the enhanced federal matching rate for newly-eligible enrollees from 90 percent of medical costs back down to the rate for other enrollees in the states, about 57 percent on average. Because there is a fair amount of churn among people eligible for Medicaid—since the population of Americans in poverty is not static—the share of the Medicaid population for whom the state receives the lower match rate will grow quickly, leading to a significant decrease in the federal match for Medicaid expansions. This, combined with new per capita caps in the program, will make it increasingly difficult for states to afford covering their residents and hence coverage will fall.
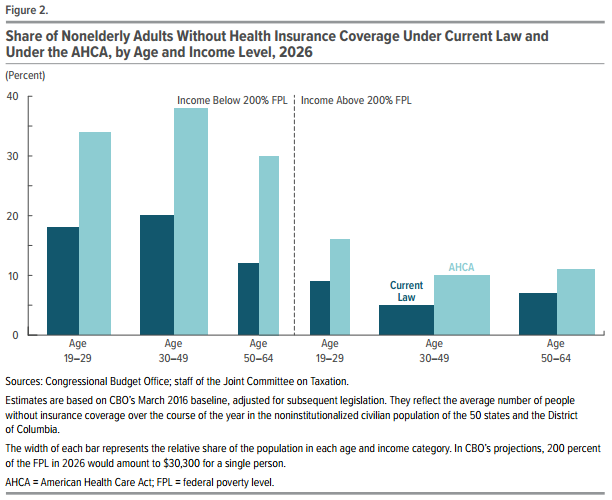
The total change in coverage from all these sources is shown below, copied in its entirety from Figure 2 in the CBO cost analysis. The share of each age group without coverage under current law is shown in dark blue, and under the proposed legislation in light blue. The three sets of bars on the left describe coverage rates for nonelderly adults below 200 percent of FPL, while the three sets of bars on the right describe the same for those above 200 percent of FPL. In Tufte-inspired fashion, the width of the bars represent the relative size of the population, so you can see that adults between 19 and 29 years of age are more likely to be lower-income, while those between 30 and 64 years of age are more likely to be higher-income. In general, low-income adults are more likely to be uninsured under current law, but that difference is exacerbated under the proposed legislation. However, no group is spared. While low-income people face much higher rates of uninsurance, even significant shares of high-income young and middle-aged adults will be less likely to be covered.
On net, the fall in Medicaid coverage and the shift in nongroup market premium subsidies, along with the elimination of the related cost sharing subsidies, lowers overall federal spending, predominantly adversely affecting lower income Americans.
But, the proposed legislation goes one step further in increasing the regressivity of health and tax policy relative to current law. The AHCA eliminates the key progressive revenue sources currently used to finance the the ACA’s subsidies and Medicaid expansions: the additional payroll tax of 0.9 percent on earned income in excess of $200,000 for individuals and $250,000 for families, as well as the extension of this 3.8 percent tax to high income earners’ investment income. Over the 10-year budget window, the Joint Committee on Taxation finds that these taxes’ repeal will cost $275 billion, not only clawing back a significant share of potential budgetary savings but providing all those benefits exclusively to very high income families. In the end, it’s clear that the coverage provisions of the AHCA disproportionately disadvantage the lower income while the tax benefits disproportionately benefits the higher income.
Enjoyed this post?
Sign up for EPI's newsletter so you never miss our research and insights on ways to make the economy work better for everyone.