A prolonged depression is guaranteed without significant federal aid to state and local governments
Congress is currently debating a new relief and recover package—the HEROES Act—that would deliver significant amounts of fiscal aid to state and local governments—more than $1 trillion over the next two years, all told. This is a very welcome proposal. The incredibly steep recession we’re currently in is guaranteed to torpedo state and local governments’ ability to collect revenues. Further, nearly all of these governments are tightly constrained—both by law as well as by genuine economic constraints—from taking on large amounts of debt to maintain spending in the face of this downward shock to their revenues. The result will be intense pressure for large cutbacks in public spending by state and local governments in coming years. Such cutbacks would be absolutely devastating to the cause of restarting the economy and allowing people to find jobs, even if the virus has completely abated.
We know how devastating these cutbacks would be because we have lived through the mistake of allowing them to drag on growth in the quite recent past. State and local governments became relentless anti-stimulus machines during most of the recovery from the Great Recession of 2008–2009. This post highlights a couple of findings from that period that should inform policymakers’ decisions this time around.
- Growth in state and local spending was far slower during the recovery following the Great Recession than in any other post–World War II business cycle on record.
- This state and local spending austerity dragged heavily on growth during that time. If this spending had instead followed the trajectory it established following the recovery from the similarly steep recession of the early 1980s, pre-recession unemployment rates could have been achieved by early 2013 rather than 2017. In short, this austerity delayed recovery by over four years.
- Recent justifications for denying aid to state and local governments sometimes rest on claims that this spending has been profligate in recent years. This is absolutely not so—growth in state and local spending has been historically slow for nearly two decades. Given the importance of what this spending focuses on (education, health care, public order), this decades-long disinvestment should be reversed, not accelerated due to an unforeseen economic crisis.
- If federal aid is passed that is sufficient to close the enormous revenue shortfalls the economic crisis will cause for state and local governments, it will create or save roughly 5–6 million jobs by the end of 2021. Without this aid, we will remain at least that far away from a full economic recovery by then.
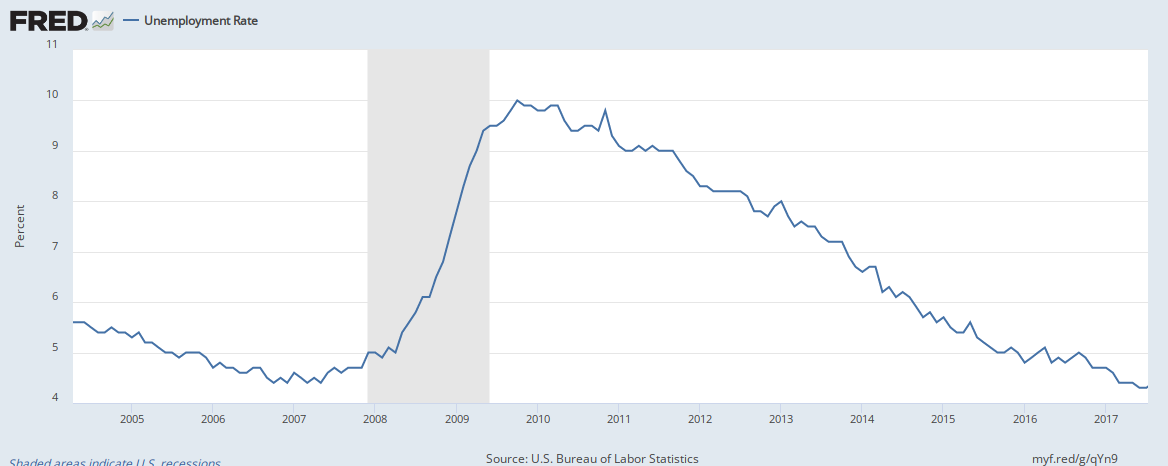
Public spending austerity was a catastrophe for recovery and growth following the Great Recession of 2008–2009. During the official recession from January 2008 to June 2009, policymakers instituted significant fiscal recovery efforts, including the American Recovery and Reinvestment Act that was passed in early 2009. However, one year after the recession’s official end, the unemployment rate was at 9.4%, and fully two years after it was still at 9.1%. The lesson here is simple: The criteria for whether or not the economy needs continued fiscal support is not “is it in official recession or not?” Instead, it is “is the economy at full employment or not?”
The spending austerity in the 2010s was the entire reason why it took a full decade to return to pre-crisis unemployment rates following the onset of the Great Recession. It is why millions of Americans struggled—through no fault of their own—to find work and it is a key reason why wages for tens of millions of Americans barely kept pace with price inflation over this time, as labor markets remained too soft to give workers the bargaining power they needed to demand better-paying jobs.
Figure A below shows state and local spending growth following each of the post–World War II recessions. The outlying red line on the bottom is growth in the recovery following the Great Recession that began in 2008. In the 31 quarters between the second quarter of 2009 (the beginning of the recovery) and the first quarter of 2017 (when the pre-crisis unemployment low was again attained), cumulative growth in state and local spending was fully 35% lower than the average that characterized comparably long recoveries in the 1960s, 1980s, and 1990s. In the beginning of 2017, this would have translated into roughly $1 trillion additional state and local spending in that quarter.
State and local spending austerity after Great Recession: Cumulative growth in real state and local spending per capita from recession’s trough
| Quarters since trough | 1949Q4 | 1954Q2 | 1958Q2 | 1961Q1 | 1970Q4 | 1975Q1 | 1980Q3 | 1982Q4 | 1992Q1 | 2001Q4 | 2009Q2 |
|---|---|---|---|---|---|---|---|---|---|---|---|
| -6 | 99.21049 | ||||||||||
| -5 | 95.98653 | 99.59585 | 98.4434 | ||||||||
| -4 | 87.45925 | 93.38582 | 96.99375 | 96.98225 | 100.1163 | 98.29394 | |||||
| -3 | 90.46947 | 95.5001 | 94.79961 | 95.57069 | 97.6778 | 97.98188 | 99.60523 | 97.50095 | 98.53784 | ||
| -2 | 95.01476 | 97.04909 | 96.52179 | 96.61648 | 97.94344 | 97.538 | 103.5001 | 99.75223 | 99.39109 | 99.10843 | 98.5735 |
| -1 | 98.79923 | 100.1851 | 98.91675 | 97.19157 | 99.79753 | 97.34781 | 101.8539 | 99.48005 | 100.1569 | 98.39556 | 99.3568 |
| 0 | 100 | 100 | 100 | 100 | 100 | 100 | 100 | 100 | 100 | 100 | 100 |
| 1 | 102.0551 | 102.4456 | 101.6133 | 99.05 | 100.1255 | 99.03592 | 99.23718 | 100.1736 | 100.0833 | 100.691 | 99.62381 |
| 2 | 102.5024 | 102.3623 | 102.968 | 99.38233 | 100.5828 | 100.0317 | 99.77792 | 99.74852 | 100.3078 | 100.6018 | 98.70917 |
| 3 | 102.1346 | 106.0772 | 103.0454 | 101.683 | 100.6052 | 101.1012 | 97.65554 | 100.389 | 100.6839 | 100.6401 | 97.12091 |
| 4 | 101.6258 | 107.2396 | 103.0721 | 100.6232 | 101.5741 | 102.0339 | 97.08549 | 100.192 | 101.6806 | 100.6476 | 96.61888 |
| 5 | 100.57 | 106.6381 | 102.7018 | 100.903 | 101.5711 | 100.0476 | 101.2689 | 101.1935 | 99.99835 | 95.59836 | |
| 6 | 101.6001 | 106.7915 | 101.6936 | 101.6938 | 101.145 | 99.09959 | 102.4039 | 100.8656 | 99.29139 | 94.49319 | |
| 7 | 101.5425 | 107.4646 | 102.7812 | 102.466 | 101.7467 | 98.56461 | 103.896 | 100.4414 | 99.43448 | 93.2946 | |
| 8 | 101.0936 | 108.1467 | 104.5983 | 103.9134 | 102.8506 | 99.3148 | 104.6949 | 100.4898 | 99.06154 | 92.30742 | |
| 9 | 100.9666 | 108.3066 | 104.537 | 103.0684 | 99.64892 | 105.8278 | 100.9927 | 98.92554 | 91.2913 | ||
| 10 | 102.6331 | 108.8601 | 106.9331 | 103.022 | 99.26214 | 107.5151 | 101.1833 | 98.77291 | 90.7663 | ||
| 11 | 99.69963 | 111.1596 | 107.7875 | 103.8055 | 99.15237 | 108.9629 | 101.3488 | 98.15312 | 89.95222 | ||
| 12 | 101.3264 | 111.4046 | 109.1672 | 104.8678 | 98.8809 | 109.5027 | 101.49 | 97.92583 | 89.51449 | ||
| 13 | 103.1024 | 112.6864 | 111.2652 | 101.5881 | 111.3006 | 102.3446 | 97.84278 | 88.98217 | |||
| 14 | 102.6488 | 112.0603 | 102.467 | 112.1587 | 103.2147 | 97.60029 | 88.56814 | ||||
| 15 | 112.8246 | 103.107 | 112.9152 | 103.2769 | 97.41108 | 88.48282 | |||||
| 16 | 113.433 | 101.0918 | 113.0382 | 103.8072 | 97.27251 | 88.56243 | |||||
| 17 | 116.0519 | 101.7876 | 113.4017 | 104.3367 | 97.50156 | 88.44135 | |||||
| 18 | 118.9303 | 101.8454 | 113.4204 | 104.0975 | 97.65594 | 88.10658 | |||||
| 19 | 120.1998 | 102.6851 | 113.5324 | 104.3275 | 97.71673 | 87.42725 | |||||
| 20 | 121.3189 | 102.909 | 114.7379 | 103.8779 | 97.89243 | 87.78742 | |||||
| 21 | 121.8949 | 115.7722 | 105.0663 | 98.2555 | 87.95363 | ||||||
| 22 | 122.9604 | 116.9909 | 105.6189 | 98.49864 | 88.52057 | ||||||
| 23 | 125.8256 | 117.2117 | 106.785 | 98.44128 | 88.93771 | ||||||
| 24 | 127.0726 | 118.3305 | 106.5341 | 98.4289 | 90.09964 | ||||||
| 25 | 127.3683 | 119.0341 | 107.019 | 90.69298 | |||||||
| 26 | 127.4523 | 120.0821 | 107.7368 | 90.56563 | |||||||
| 27 | 129.3421 | 120.9104 | 108.37 | 91.69795 | |||||||
| 28 | 131.3453 | 122.1948 | 109.0767 | 91.66886 | |||||||
| 29 | 133.6897 | 123.808 | 110.5485 | 91.86208 | |||||||
| 30 | 135.1927 | 123.6465 | 111.7521 | 92.01002 | |||||||
| 31 | 136.0137 | 124.0182 | 112.0435 | 91.94945 |
Source: Author’s analysis of data from the National Income and Product Accounts (NIPA) of the Bureau of Economic Analysis (BEA), tables 1.1.6 and 2.1.
This slow growth clearly delayed economic recovery for U.S. workers by years. If one takes the trajectory of spending that characterized the 1980s and assumes this had been replicated after the 2009 recovery began, state and local spending would have been $800 billion higher by the first quarter of 2013. At that point in the recovery, unemployment was still at 8% and the Federal Reserve was years away from thinking about raising interest rates. This means that this extra spending, if financed by federal aid, would have translated directly into extra economic output and jobs. $800 billion in spending, even with modest multipliers, would have supported roughly 8 million more jobs in that year, enough to restore the economy to pre-crisis unemployment rates (4.4%) even with higher labor force participation than prevailed in 2013. In short, state and local spending austerity by itself delayed the recovery to pre-Great Recession unemployment rates by probably about 4 years.
Another thing to note on this graph is that besides the recovery from the Great Recession, the next-slowest growth of state and local spending on record is during the recovery following the 2001 recession. This means that the past two recoveries have seen abnormally slow growth of state and local government spending. This in no way supports recent claims that states only need federal aid in the current moment because of their own profligacy. Instead, they need aid because a once-in-a-generation shock has smashed in the economy.
Finally, state and local governments are currently forecast to be facing revenue shortfalls as large as $1 trillion over the coming years. If no help is forthcoming from the federal government to close these shortfalls, the result will be an economic disaster—one that is not confined to these governments.
Besides the obvious loss of valuable public services, cuts of this size would quickly ripple out from the public sector and destroy private-sector jobs. Filling in these shortfalls and averting these cuts would save or create more than 5 million jobs by the end of 2021, with a majority of these in the private sector. The arithmetic of this is straightforward—$1 trillion of state cuts averted between now and the end of 2021 corresponds to an average annual increase in spending of roughly $570 billion. This corresponds to $740 billion in additional economic activity when taking multiplier effects into account (for multipliers for state and local aid, see Table 1 in this). This represents just under 4% of total national income, and would support (all else equal) about 4% more employment in that year. Based on the severely depressed employment level of April 2020, this would be a bit over 5 million jobs.
These multiplier effects include the reduced spending on private-sector businesses that would result if public-sector workers were laid off, as well as the income-depressing effect of cutting needed safety net programs (Medicaid) or public goods (like public transportation or education). As households have to pay out of pocket for goods formerly provided in part by the public sector, they would have less money to spend on other businesses’ output. In the first two years following the Great Recession, federal aid to states to support Medicaid spending has been shown to have been possibly the single most effective bit of fiscal support provided over the entire crisis.
In many ways, the economy is currently approaching a knife edge in how recovery will proceed. If the virus relents and effective public health measures are undertaken that allow a phased reopening of business, and if the federal government provides sufficient measures for relief and recovery during this crisis, then recovery could be rapid. Many workers who lost their jobs in recent months are on temporary layoff and could reestablish ties with employers quickly if confidence and demand for output was high. But this confidence and demand will be savaged if policymakers allow state and local governments’ spending to be hamstrung by the crisis. These subnational governments spend about $4 trillion every year in the economy, making them the second-largest source of spending outside of the federal government. If they are forced into crash-cutting, the entire economy will suffer. And this crash-cutting is unnecessary—the federal government has the capacity to transfer resources to these governments to keep this suffering from happening. They need to use it.
Enjoyed this post?
Sign up for EPI's newsletter so you never miss our research and insights on ways to make the economy work better for everyone.